Ehlers Leading Indicator Trading Strategy
Author: ChaoZhang, Date: 2023-10-31 14:13:30Tags:

Overview
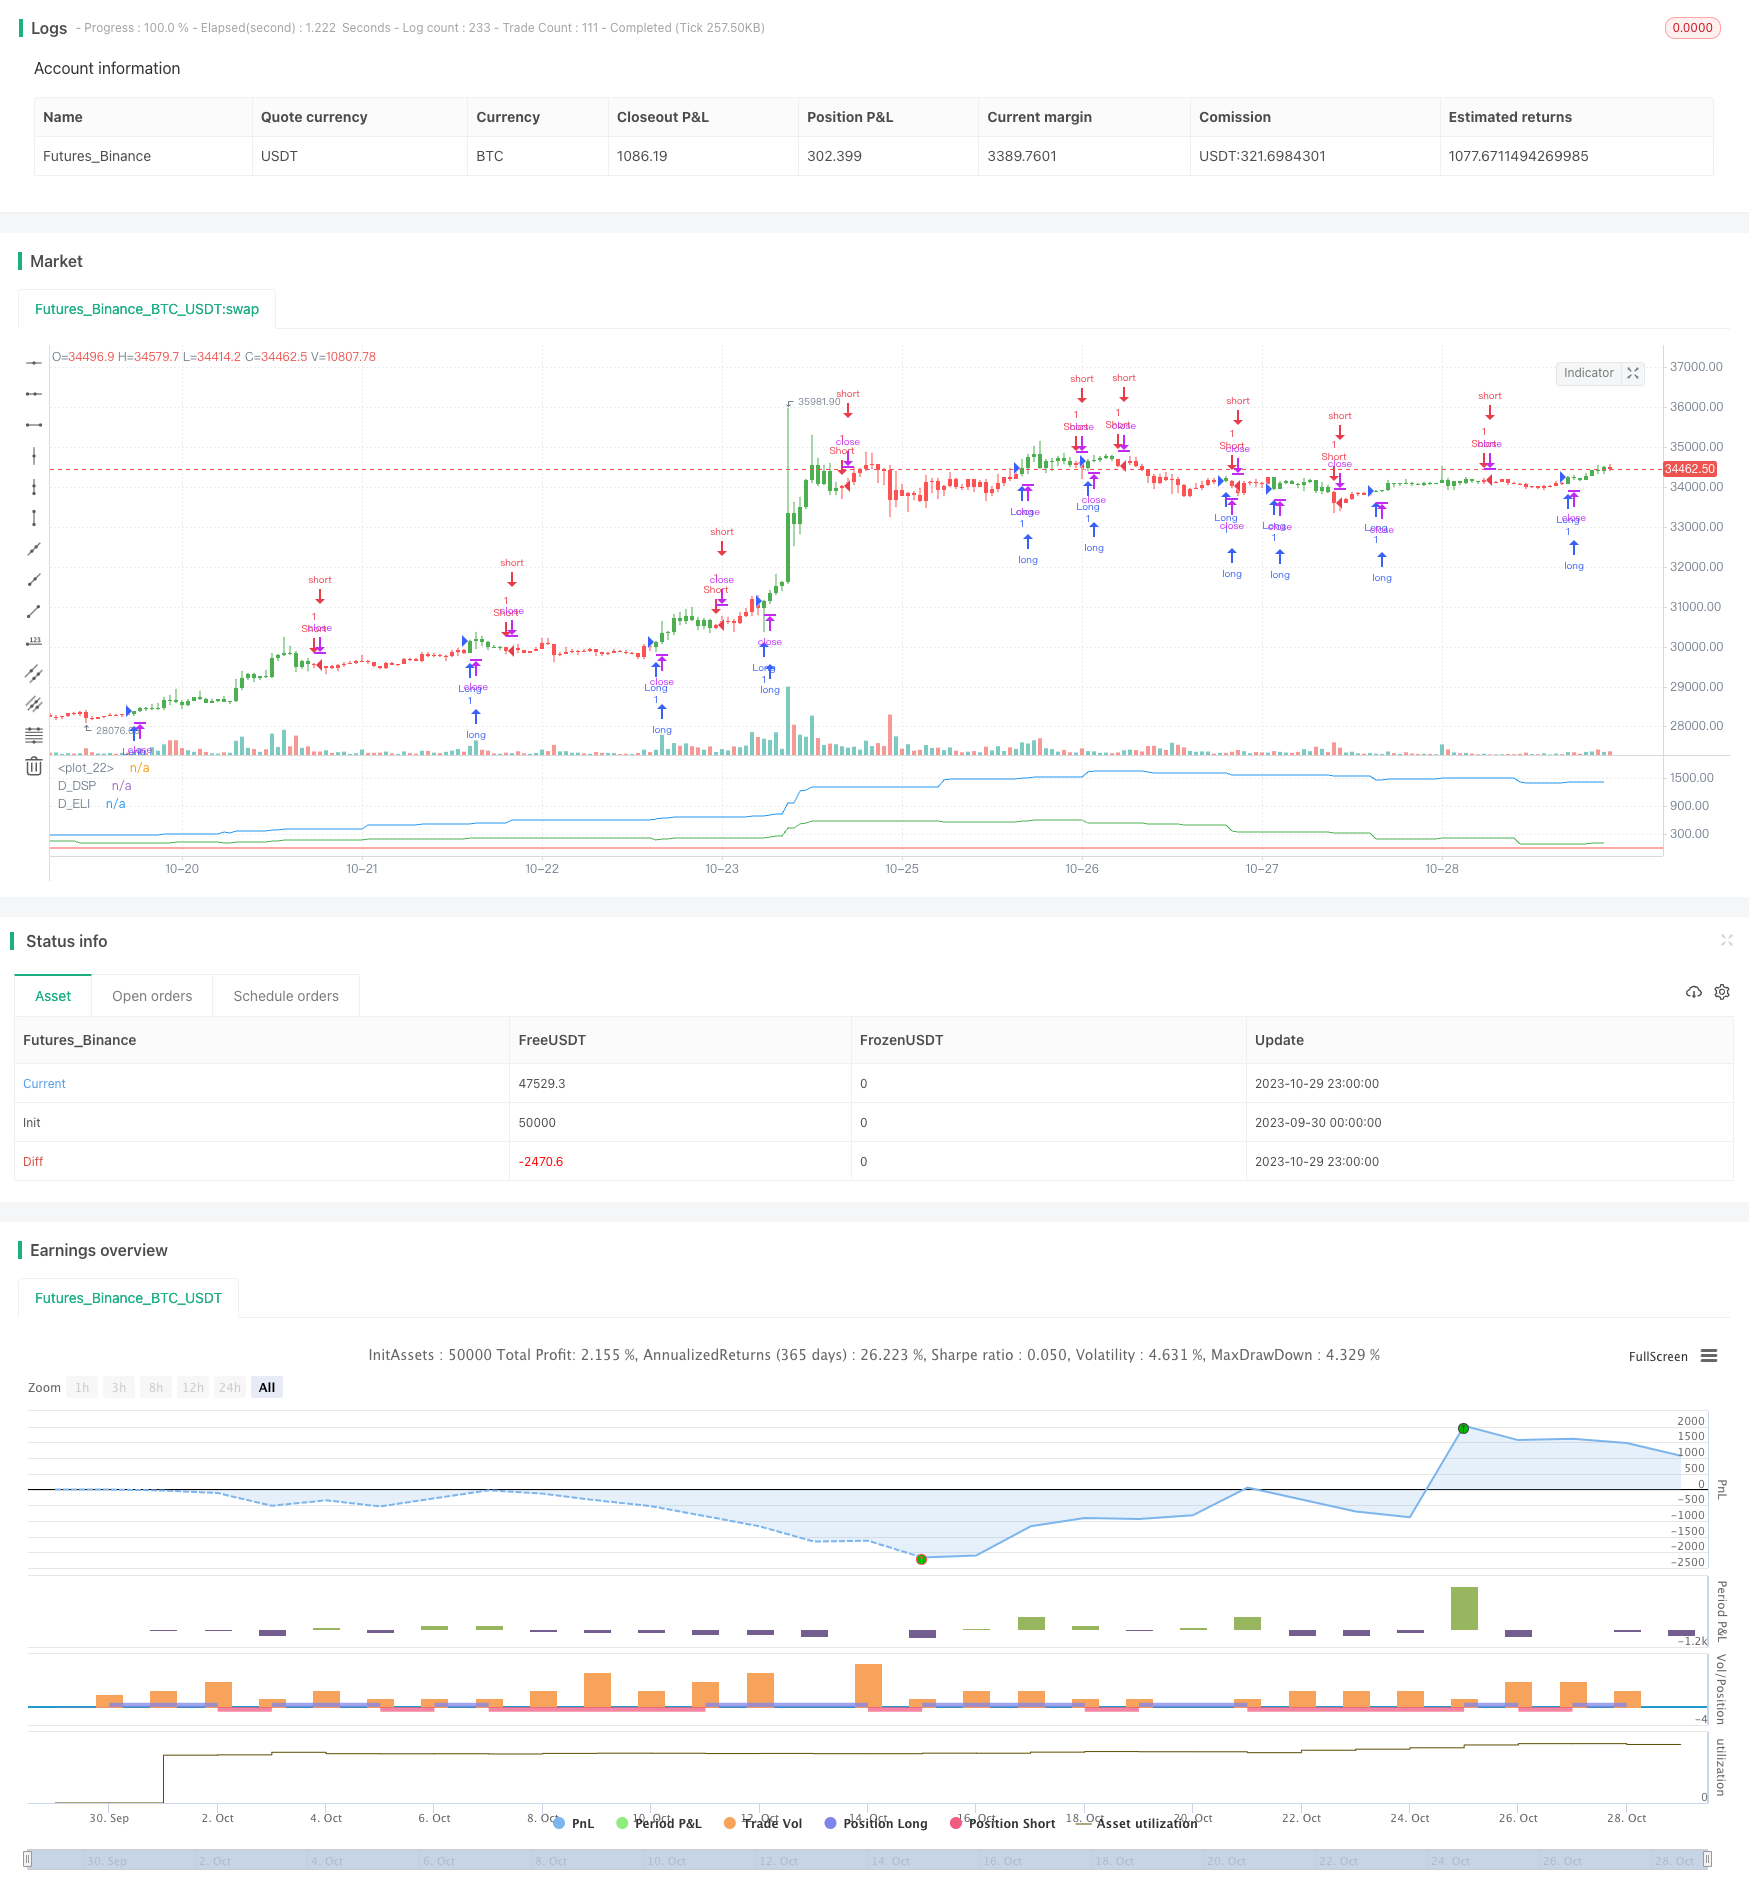
This strategy is based on the ideas of technical analysis master John Ehlers, using the Ehlers Leading Indicator to judge the historical cycle of prices and generate buy and sell signals. The strategy combines the detrended synthetic price and the Ehlers Leading Indicator, generating trading signals when the indicator line crosses over the detrended synthetic price.
Strategy Principle
The strategy first calculates the Detrended Synthetic Price (DSP), which is obtained by subtracting the value of a 3rd order Butterworth filter from a 2nd order Butterworth filter to get a function that is in phase with the dominant cycle of real price data.
Then it calculates the Ehlers Leading Indicator (ELI), which is obtained by subtracting the simple moving average of the detrended synthetic price from the detrended synthetic price itself, and can give advanced indication of a cyclic turning point.
Finally, when the ELI line crosses over the DSP, buy and sell signals are generated. If ELI crosses above DSP, a buy signal is generated. If ELI crosses below DSP, a sell signal is generated.
Advantage Analysis
The biggest advantage of this strategy is using the Ehlers Leading Indicator to judge turning points in price trends ahead of time. It allows entering positions before prices start to reverse, thus capturing larger profit potential.
In addition, combining the detrended price for trade signal generation filters out irrelevant low frequency information in prices, making the strategy more focused on cyclical patterns in prices without being disturbed by short-term market noise.
Risks and Optimization
The main risk of this strategy is the possibility of ELI incorrectly identifying signals, resulting in premature entry and losses. This can be optimized by adjusting indicator parameters to fine-tune indicator sensitivity.
Traders should also note this strategy only applies to products with obvious cyclical patterns. It would be less effective for products with chaotic price movements. Proper evaluation of a product’s cyclicality is advised before using this strategy.
Risks can be managed by confirming signals with other indicators, or adjusting position sizing and stop loss strategies. For example, setting stop loss orders, reducing position sizes etc.
Summary
This strategy identifies cyclicality in prices using the Ehlers Leading Indicator, entering positions early before new cycles start, making it a typical trend following strategy. It is very effective for products with clear cyclicality, but also carries certain risks of false signals. Optimization through parameter tuning and risk management can make the strategy more robust.
/*backtest
start: 2023-09-30 00:00:00
end: 2023-10-30 00:00:00
period: 1h
basePeriod: 15m
exchanges: [{"eid":"Futures_Binance","currency":"BTC_USDT"}]
*/

//@version=2
////////////////////////////////////////////////////////////
//  Copyright by HPotter v1.0 23/03/2017
// This Indicator plots a single
// Daily DSP (Detrended Synthetic Price) and a Daily ELI (Ehlers Leading
// Indicator) using intraday data.
// Detrended Synthetic Price is a function that is in phase with the dominant
// cycle of real price data. This one is computed by subtracting a 3 pole Butterworth
// filter from a 2 Pole Butterworth filter. Ehlers Leading Indicator gives an advanced
// indication of a cyclic turning point. It is computed by subtracting the simple
// moving average of the detrended synthetic price from the detrended synthetic price.
// Buy and Sell signals arise when the ELI indicator crosses over or under the detrended
// synthetic price.
// See "MESA and Trading Market Cycles" by John Ehlers pages 64 - 70.
//
// You can change long to short in the Input Settings
// Please, use it only for learning or paper trading. Do not for real trading
////////////////////////////////////////////////////////////
strategy(title="D_ELI (Ehlers Leading Indicator)", shorttitle="D_ELI (Ehlers Leading Indicator)")
Length = input(7, minval=1)
reverse = input(false, title="Trade reverse")
hline(0, color=red, linestyle=line)
xHL2 = request.security(syminfo.tickerid, 'D', hl2)
xEMA1 = ema(xHL2, Length)
xEMA2 = ema(xHL2, 2 * Length)
xEMA1_EMA2 = xEMA1 - xEMA2
xResultEMA = ema(xEMA1_EMA2, Length)
nRes = xEMA1_EMA2 - xResultEMA
pos = iff(nRes > 0, 1,
	     iff(nRes < 0, -1, nz(pos[1], 0)))
possig = iff(reverse and pos == 1, -1,
          iff(reverse and pos == -1, 1, pos))
if (possig == 1)
    strategy.entry("Long", strategy.long)
if (possig == -1)
    strategy.entry("Short", strategy.short)
barcolor(possig == -1 ? red: possig == 1 ? green : blue )
plot(request.security(syminfo.tickerid, "D", xEMA1_EMA2), color=blue, title="D_DSP")
plot(request.security(syminfo.tickerid, "D", nRes), color=green, title="D_ELI")
- Bollinger Band Momentum Burst Strategy
- Multi-factor Strategy
- Golden Trend Tracking Strategy Based on Periodic Investment
- Ichimoku Kinko Hyo Cross Strategy
- Polygon Moving Average Strategy
- Pivot Detector Oscillator Trend Trading Strategy
- Variance Reversion Trading Strategy
- Trend Trading Strategy Based on EMA Crossover
- Bollinger Bands Reversal Oscillation Trend Strategy
- EMA and MAMA Indicators Based Trading Strategy
- trend-following strategy based on moving averages
- Leledec DEC Strategy
- Stochastic RSI with Auto Buy Scalper Strategy
- Breakout Trading Strategy with Scalability
- Bollinger Bands and StochRSI Momentum Strategy
- RSI Long Short Automated Trading Strategy
- Trendless MACD Strategy
- VB Strategy Based on Volume Balances
- Volatility Breakout Trading Strategy
- Triple Moving Average Crossover Strategy