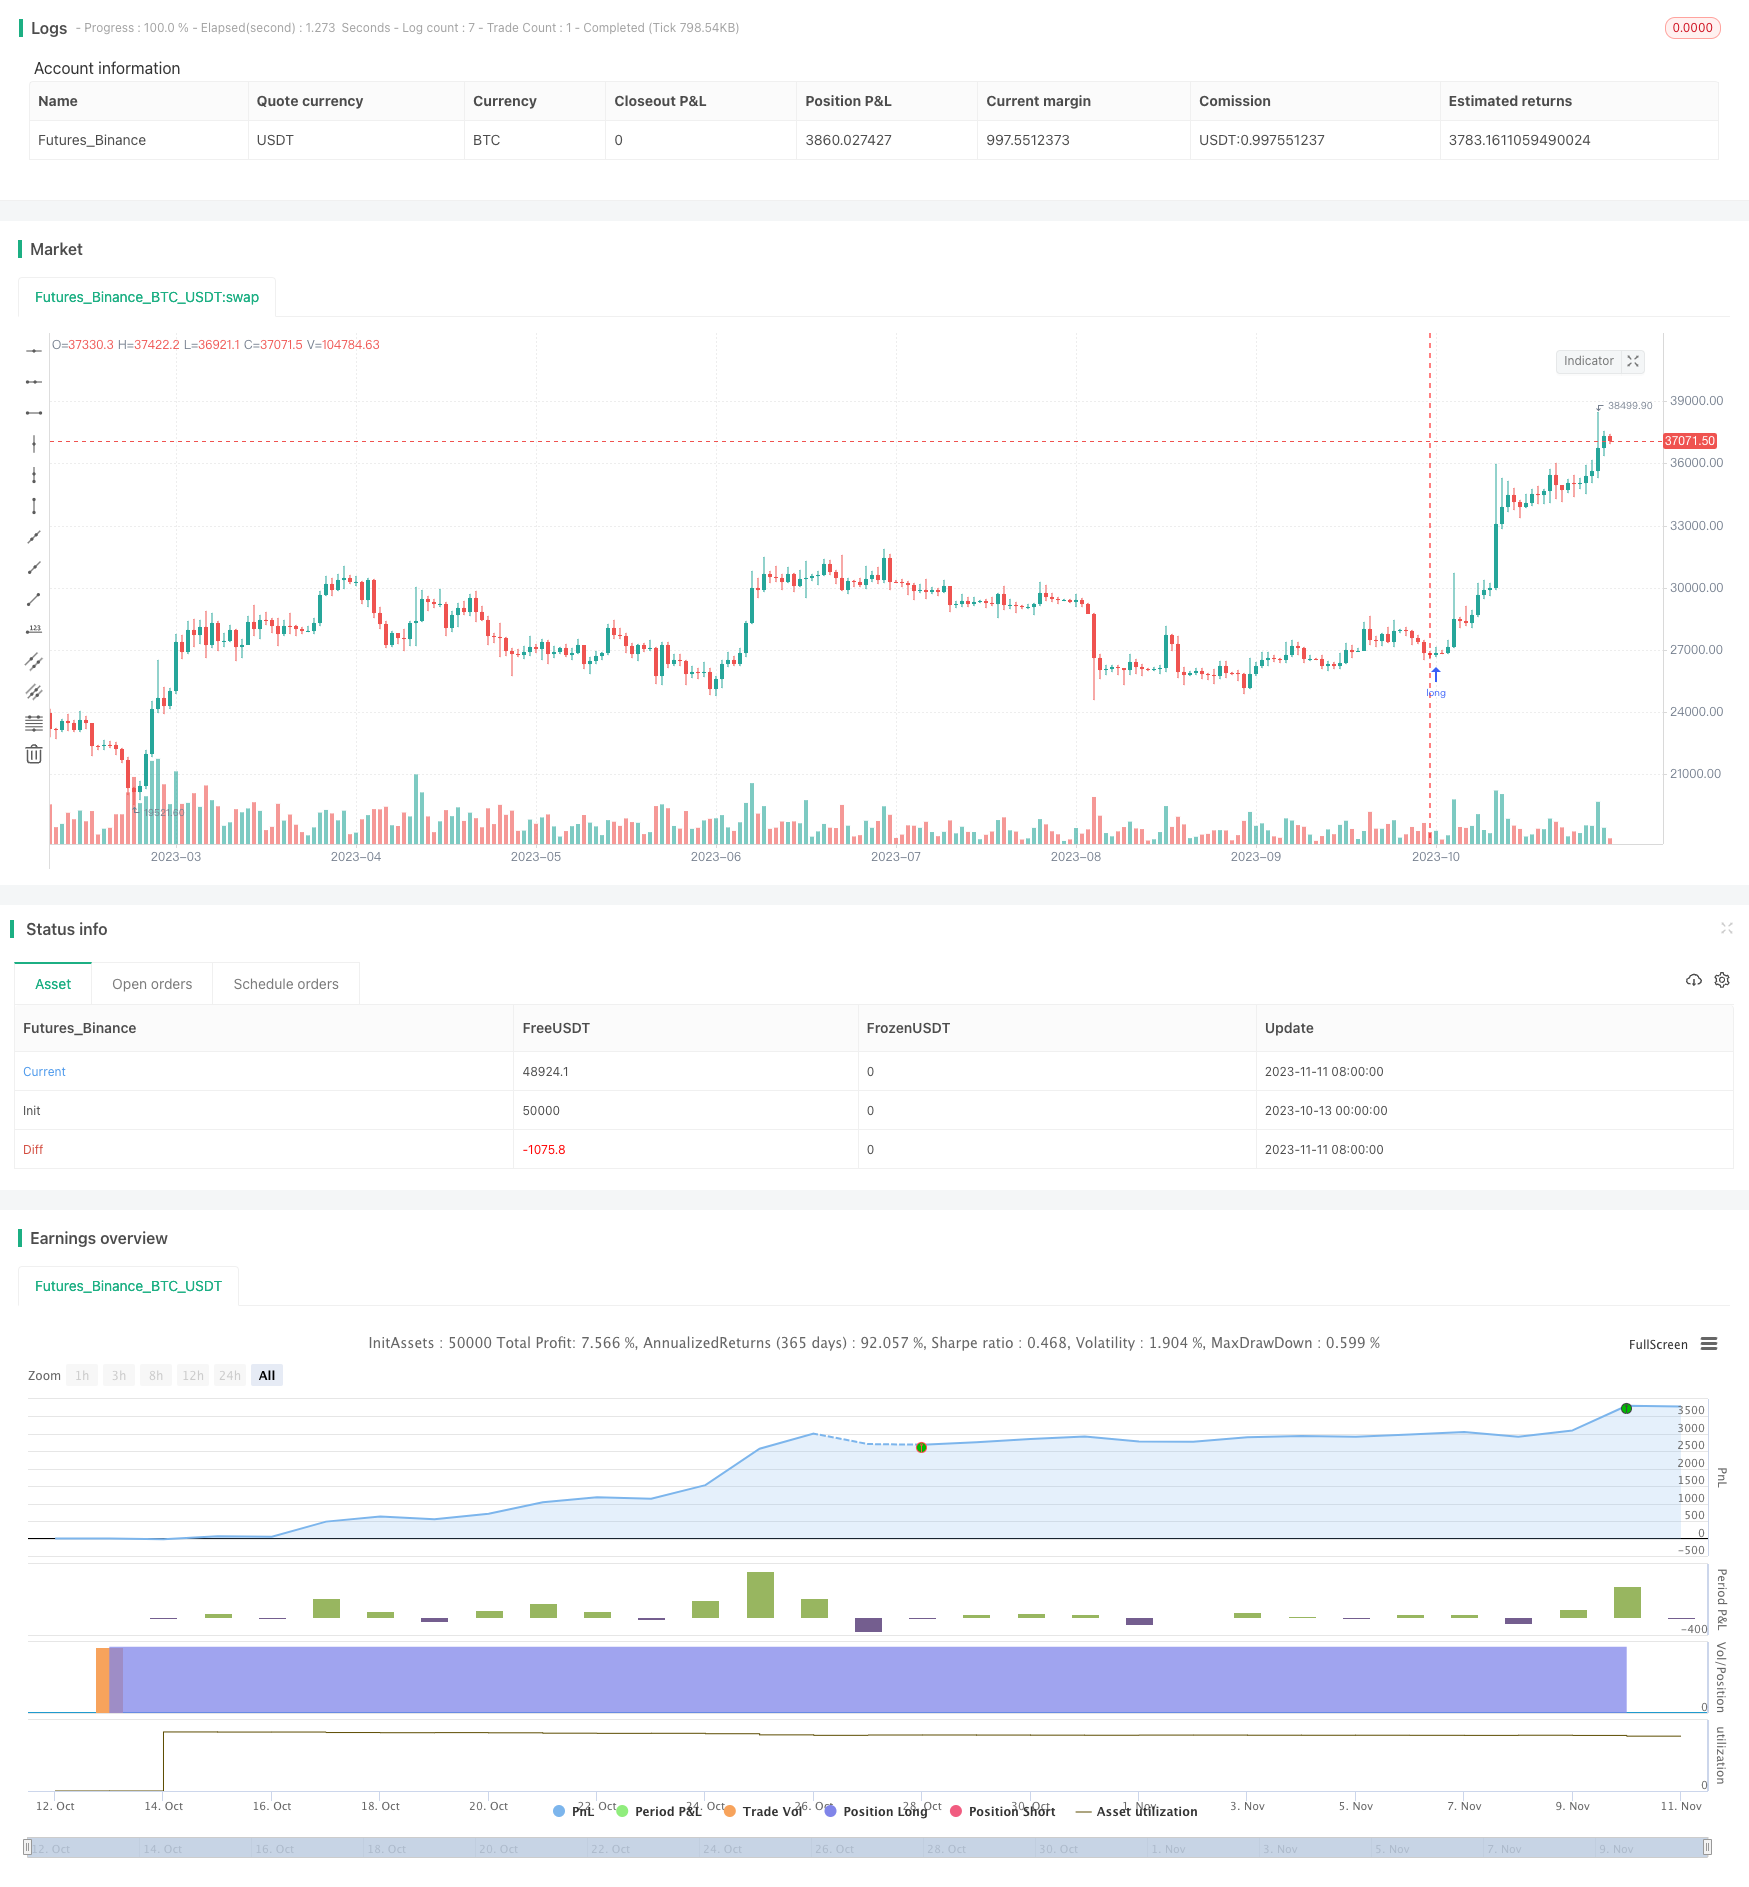
Coppock Curve Based Quantitative Trading Strategy
Author: ChaoZhang, Date: 2023-11-13 11:44:55Tags:

Overview
This strategy utilizes the lesser known Coppock Curve technical indicator to implement quantitative trading. The Coppock Curve is derived by taking a weighted moving average of the rate of change (ROC) of a market index like S&P 500 or a trading equivalent like SPY ETF. Buy signals are generated when the Coppock Curve crosses above zero and sell signals when it crosses below. An optional trailing stop loss is available to lock in profits. The strategy uses $SPY Coppock curve as a proxy to generate trade signals on other ETFs and stocks.
Principles
The strategy uses Coppock Curve as the technical indicator for generating trading signals. The Coppock Curve formula is:
Coppock Curve = 10-period WMA (14-period ROC + 11-period ROC)
Where ROC rate of change is calculated as: (Current Close - Close N periods ago) / Close N periods ago
The strategy calculates the Coppock Curve based on the closing price of $SPY. Buy signals are generated when the curve crosses above zero and sell signals when it crosses below.
Advantages
- Uses unique Coppock Curve indicator which has better predictive power than common indicators like moving averages
- Configurable parameters for optimization like WMA period, ROC period etc.
- Uses $SPY as signal source which has strong market representativeness
- Optional trailing stop loss to lock in profits and reduce drawdowns
Risks
- Coppock Curve is not a widely used indicator, its efficacy needs validation
- Signal lag may exist, parameters need to be optimized
- Overly wide stop loss may miss pullback opportunities
- Reliance on single indicator can produce false signals
Optimization Directions
- Test optimal parameter combinations across different markets and stocks
- Combine with other indicators to filter out false signals e.g. volume
- Dynamic optimization of stop loss percentage
- Consider other entry signals like number of bars or price breakthroughs
Conclusion
The strategy utilizes the unique curve shape characteristics of the Coppock Curve to generate trade signals. Compared to common indicators, the Coppock Curve has stronger predictive power. But as a standalone indicator, its reliability needs validation. It’s recommended to combine it with other factors to filter false signals. Through parameter optimization, stop loss optimization and combining with other indicators, this strategy can become an effective quantitative trading system.
/*backtest
start: 2023-10-13 00:00:00
end: 2023-11-12 00:00:00
period: 1d
basePeriod: 1h
exchanges: [{"eid":"Futures_Binance","currency":"BTC_USDT"}]
*/

// This source code is subject to the terms of the Mozilla Public License 2.0 at https://mozilla.org/MPL/2.0/
// © RolandoSantos

//@version=4
strategy(title = "Coppock Curve", shorttitle = "Copp Curve Strat", default_qty_type=strategy.cash, default_qty_value=10000, initial_capital=10000)

///trail stop
longTrailPerc = input(title="Trail Long Loss (%)", minval=0.0, step=0.1, defval=100) * 0.01

// Determine trail stop loss prices
longStopPrice = 0.0

longStopPrice := if (strategy.position_size > 0)
    stopValue = close * (1 - longTrailPerc)
    max(stopValue, longStopPrice[1])
else
    0
//Use SPY for Copp Curve entries and exits//
security = input("SPY")
ticker = security(security, "D", close)

///Copp Curve////
wmaLength = input(title="WMA Length", type=input.integer, defval=10)
longRoCLength = input(title="Long RoC Length", type=input.integer, defval=14)
shortRoCLength = input(title="Short RoC Length", type=input.integer, defval=11)
source = ticker
curve = wma(roc(source, longRoCLength) + roc(source, shortRoCLength), wmaLength)

///Lower Band Plot///
band1 = hline(0)
band0 = hline(100)
band2 = hline(-100)
fill(band1, band0, color=color.green, transp=90)
fill(band2, band1, color=color.red, transp=90)
plot(curve, color=color.white)

///Trade Conditions///
Bull = curve > 0
Bear = curve < 0

///Entries and Exits//
if (Bull)
    strategy.entry("Long", strategy.long, comment = "LE")


if (Bear)
    strategy.close("Long", qty_percent=100, comment="close")

// Submit exit orders for trail stop loss price
if (strategy.position_size > 0)
    strategy.exit(id="Long Trail Stop", stop=longStopPrice)
- EMA Percentage Channel with Bollinger Band Range Trading Strategy
- Dual EMA Crossover Strategy
- Gradual Stop Loss Movement Strategy
- Momentum Breakout Strategy with Volatility Stop
- Extreme Distribution Swing Strategy
- Multi-indicator Crossover Strong Trend Tracking Strategy
- Momentum Breakout Trading Strategy Based on Price Breakout and Mean Reversion
- Momentum Price Trend Tracking Strategy
- FX Strategy Based on Fractal Waves and SMMA
- Moving Average Crossover and Upper Rail Breakthrough Impulse Strategy
- High Probability Breakthrough Trading Strategy Based on Pressure Balance
- Fast RSI Risk Control Compound Futures Trading Strategy
- Dual DI Crossover Daily Trading Strategy
- Bollinger Band Breakout Strategy
- Moving Average Trading Strategy
- Williams' Alligator Strategy
- Dual Moving Average Crossover Strategy
- Long-Term Trend Reversal Strategy
- Dual Moving Average Crossover Persistent Uptrend Strategy
- Comprehensive Automated Trading Moving Average Rainbow Strategy