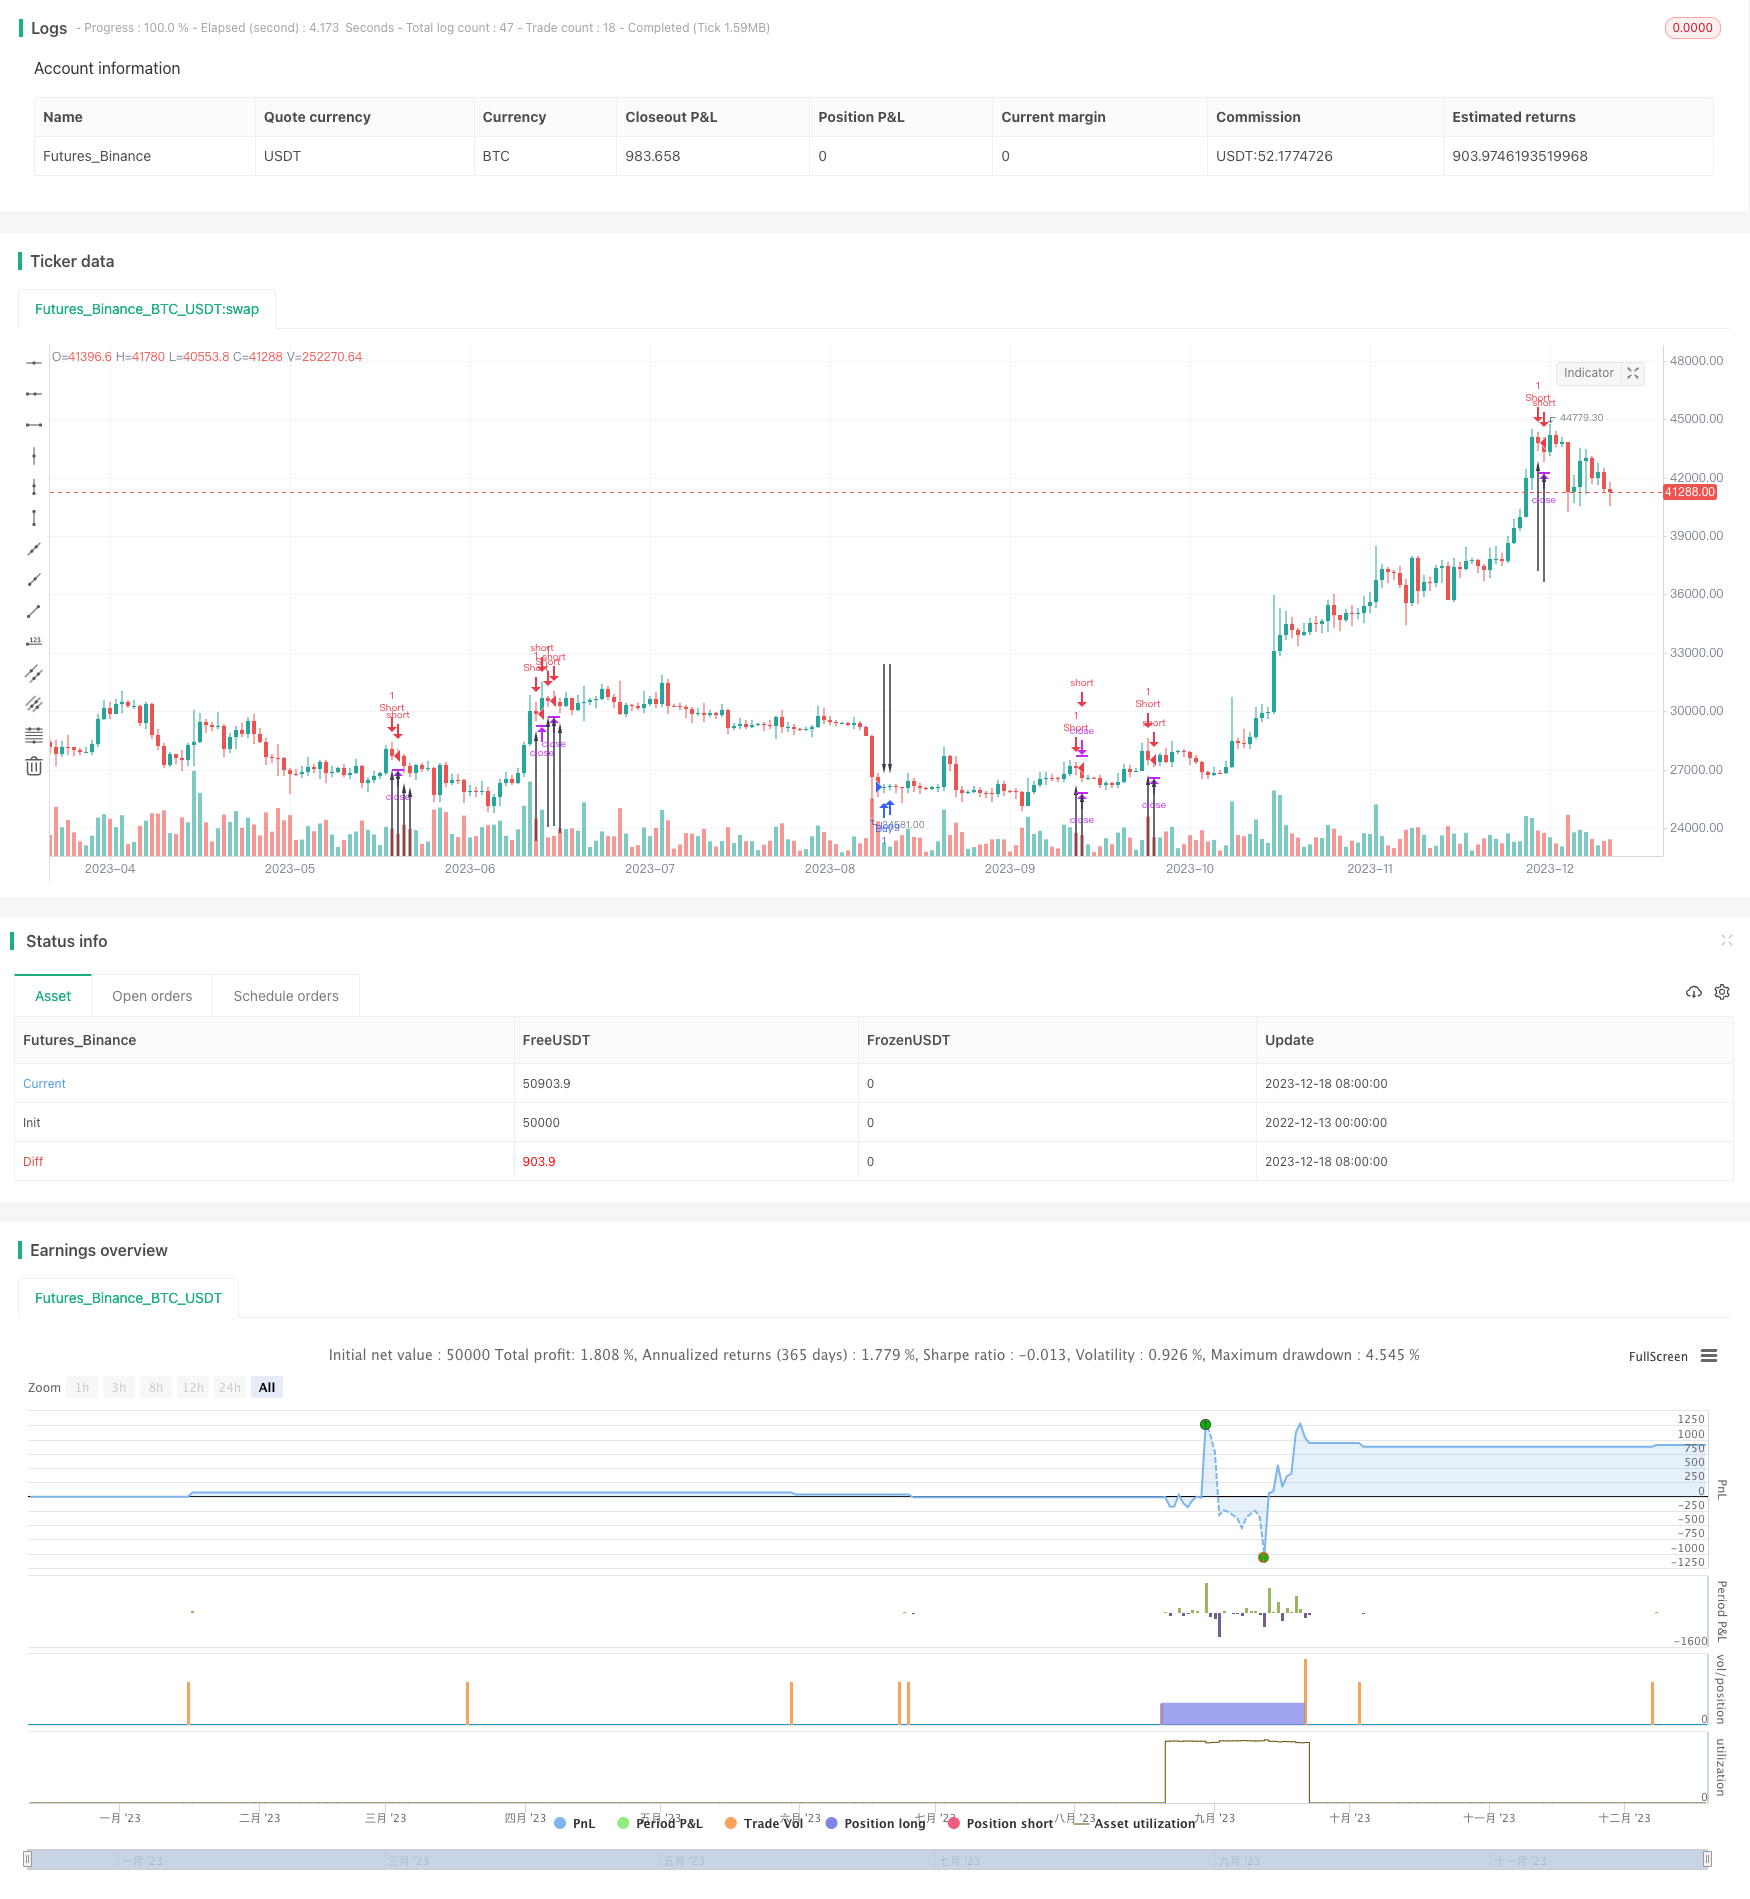
Bollinger Band-based Price Action Strategy
Author: ChaoZhang, Date: 2023-12-20 14:03:52Tags:

Overview
The name of this strategy is “Bollinger Band-based Price Action Strategy”. It integrates price action analysis and Bollinger Bands to generate trading signals based on compound condition judging.
Strategy Principle
This strategy first calculates the upper and lower rails of Bollinger Bands, and then judges whether the last K-line breaks through the upper or lower rails. At the same time, it also judges whether the entity of the last K-line is only half of the previous K-line entity. When both conditions are met, a trading signal is issued.
Specifically, the strategy utilizes the situation where red K-line entities become smaller, reaching only half of the previous K-line entity during a downward trend, together with the last K-line’s closing price breaking through the Bollinger Band lower rail as a buy signal. On the contrary, it utilizes the situation where green K-line entities become smaller, reaching only half of the previous K-line entity during an upward trend, together with the last K-line’s closing price breaking through the Bollinger Band upper rail as a sell signal.
Advantage Analysis
This strategy combines technical indicators and price behavior analysis, which can effectively filter false breakouts. At the same time, it only issues signals at inflection points, avoiding repetitive trading during trends. In addition, the strategy utilizes the characteristics of K-line entity contraction to lock the inflection point after a minor adjustment. These advantages can improve the stability and profitability of the strategy.
Risk Analysis
The main risks of this strategy lie in the improper parameter settings of Bollinger Bands and breakout failures. If the parameters of Bollinger Bands are set too large or too small, misjudgments will occur. In addition, even if the price breaks through the upper or lower rails of Bollinger Bands, it may be a false breakout and fail to form a real trend reversal. These risks can all lead to trading losses of the strategy. To reduce these risks, parameters of Bollinger Bands can be adjusted accordingly, or other indicators can be added for combination verification.
Optimization Directions
This strategy can be optimized in the following aspects:
Optimize Bollinger Band parameters to capture trends and fluctuations more effectively.
Add moving stop loss to lock in profits and manage risks.
Incorporate other indicators such as MACD, RSI for verification to filter false signals.
Add machine learning algorithms, train models with big data, and dynamically optimize strategy parameters and indicator weights.
Conclusion
This strategy successfully combines price action and Bollinger Bands, obtaining relatively high profitability with low risk. It only issues signals at key points, avoiding interference from noises. Through continuous optimization of parameters and filtering criteria, this strategy is expected to obtain more steady alpha. It provides a reliable template for quantitative trading practice.
/*backtest
start: 2022-12-13 00:00:00
end: 2023-12-19 00:00:00
period: 1d
basePeriod: 1h
exchanges: [{"eid":"Futures_Binance","currency":"BTC_USDT"}]
*/

//@version=4
// main codebody taken from Trader Noro - Noro's Crypto Pattern for H1
// Intraday strategy- Exit at EOD at all cost

strategy(title = "Price Action + Bollinger Strategy ",overlay=true)
bar = close > open ? 1 : close < open ? -1 : 0
body = abs(close - open)
avgbody = sma(body, 100)

//calculate simple moving average bollinger bands
b_sma = input(21,minval=1,title=" SMA candle")
b_sma_no_of_deviations = 2.1
b_sma_signal = sma(close, b_sma)
b_sma_deviation = b_sma_no_of_deviations * stdev(close, b_sma)
b_sma_upper= b_sma_signal + b_sma_deviation
b_sma_lower= b_sma_signal - b_sma_deviation

up1 = body < body[1] / 2 and bar[1]==1 and bar == -1 and close[1] > b_sma_upper
dn1 = body < body[1] / 2 and bar[1]==-1 and bar == 1 and close[1] < b_sma_lower
up2 = false
dn2 = false
up2 := (up1[1] or up2[1]) and close < close[1]
dn2 := (dn1[1] or dn2[1]) and close > close[1]
plotarrow(up1 or up2 ? 1 : na, colorup = color.black, colordown = color.black, transp = 0)
plotarrow(dn1 or dn2 ? -1 : na, colorup = color.black, colordown = color.black, transp = 0)

strategy.entry("Buy", true, when = dn1)
strategy.exit("exit", "Buy", profit = 3, loss = 1.5)

strategy.entry("Short", false, when = up1)
strategy.exit("exit", "Short", profit = 3, loss = 1.5)
- Double Moving Average Reversal Strategy
- Logarithmic Price Forecasting Strategy
- Simple Moving Average Crossover Strategy
- Bollinger Bands and RSI Trend Following Strategy
- Meticulous EMA Crossover Strategy
- Trend Following Strategy Based on Moving Average
- RSI Trading Strategy
- Turtle Trend Trading System
- Multiple Moving Averages Crossover Trading Strategy
- Flexible MA/VWAP Crossover Strategy with Stop Loss/Take Profit
- Dual Moving Average Range Breakout Strategy
- Grid Strategy with Moving Average Lines
- Dual Moving Average Intelligent Tracking Strategy
- RSI-EMA Trend Breakout Strategy
- Pivot Point Forecast Oscillator Backtesting Strategy
- Integrated Ichimoku Keltner Trading System Based on Moving Average Strategy
- Dual-Tracking Turtle Trading Strategy
- Ichimoku Kinko Hyo Based BTC Trading Strategy
- AO Indicator Based Trend Following Strategy
- Universal Sniper Strategy