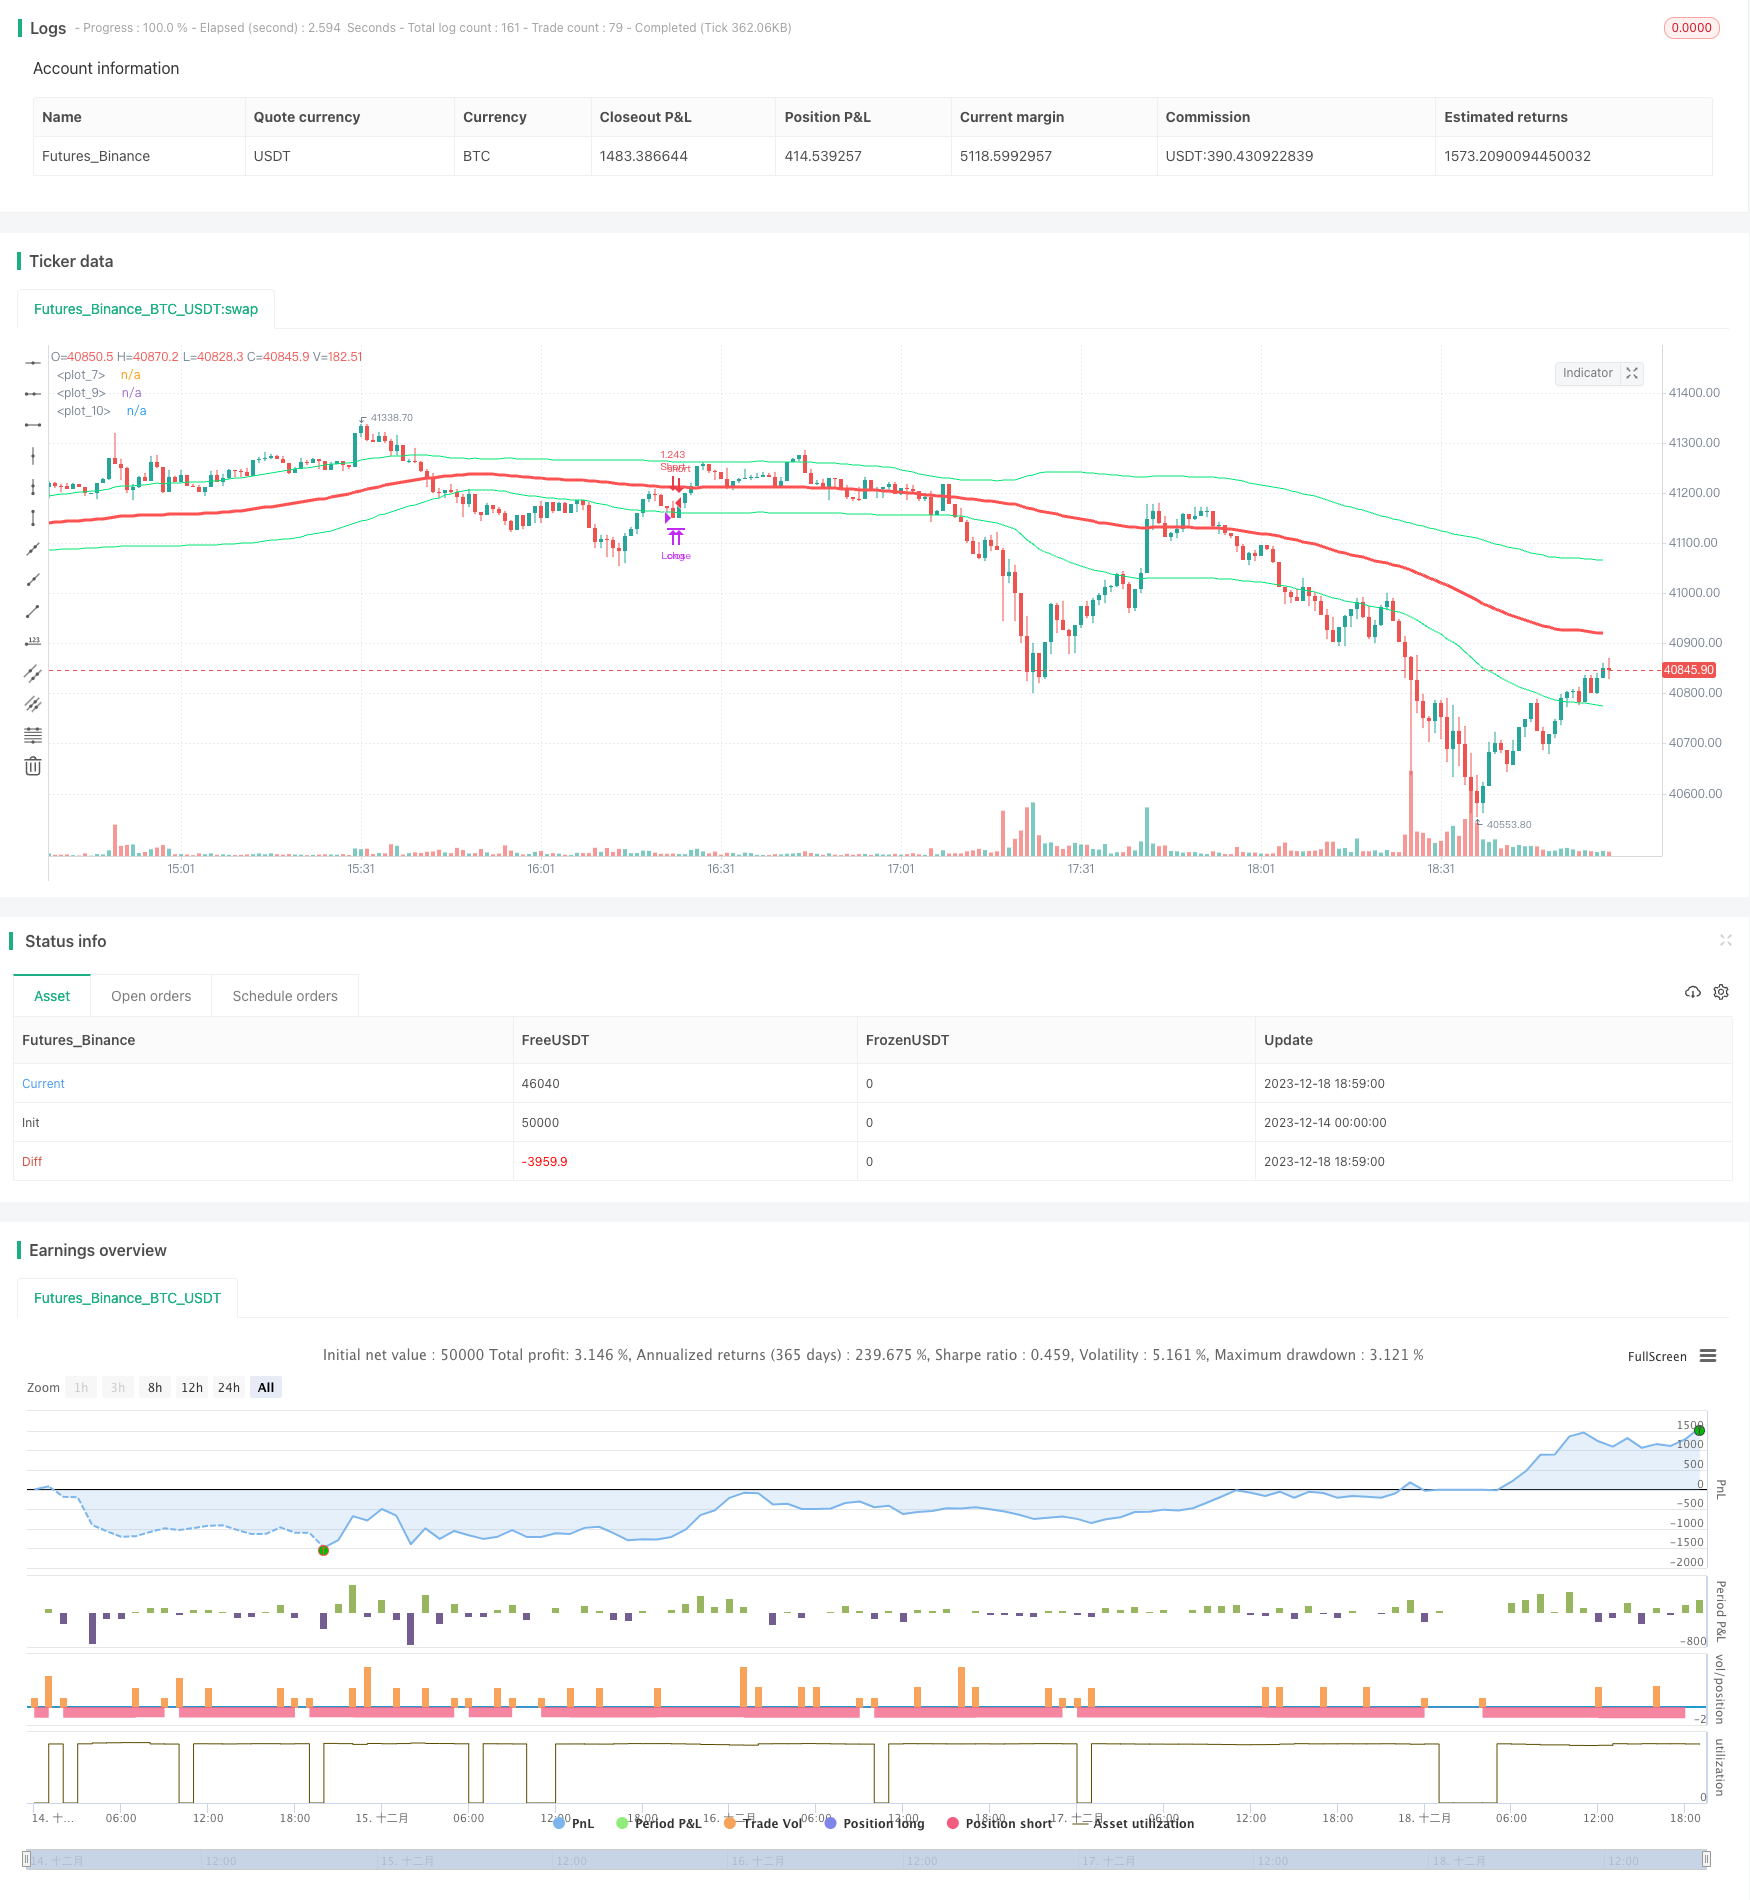
Single Moving Average Crossover Bollinger Bands Strategy
Author: ChaoZhang, Date: 2023-12-22 14:10:14Tags:

Overview
This strategy is based on single moving average and Bollinger Bands indicator. It generates buy and sell signals when price breaks through the upper or lower band of Bollinger Bands. Also it incorporates the direction of moving average to determine the trend, only taking long when MA is rising and short when MA is falling.
Strategy Logic
The strategy mainly uses the following indicators for judgment:
- Moving Average (SMA): Simple moving average of CLOSE price, representing the price trend.
- Upper Bollinger Band: Represents the resistance level, breakout indicates a strong momentum.
- Lower Bollinger Band: Represents the support level, breakdown indicates a possible trend reversal.
The specific trading signals are:
- Buy Signal: When close price breaks through the upper band and the MA is rising.
- Sell Signal: When close price breaks through the lower band and the MA is falling.
By combining the trend and breakout, the trading signal becomes more reliable and avoids false breakout.
Advantages
- Simple and clear rules, easy to understand and implement.
- MA judges the general trend to avoid short bull and long bear market.
- Bollinger Bands upper & lower band locates local breakout points accurately.
- Relatively small drawdowns, matches most people’s risk preference.
Risks
- Single indicator tends to generate false signals, can be improved by parameter tuning.
- Cannot cope with large market fluctuations, can adjust stop loss accordingly.
- Unable to profit more from mega trends, can consider larger position size.
Improvements
- Optimize MA periods to fit more products.
- Add other filters like MACD to reduce false signals.
- Dynamically adjust stop loss to limit maximum drawdown.
- Introduce money management to stabilize PnL performance.
Conclusion
In general this is a simple but practical strategy suitable for most people. With some tuning and optimizations it can be more robust and adaptive to more market situations. It is a strategy worth recommending.
/*backtest
start: 2023-12-14 00:00:00
end: 2023-12-18 19:00:00
period: 1m
basePeriod: 1m
exchanges: [{"eid":"Futures_Binance","currency":"BTC_USDT"}]
*/

//@version=2
strategy(title="single sma cross", shorttitle="single sma cross",default_qty_type = strategy.percent_of_equity, default_qty_value = 100,overlay=true,currency="USD")
s=input(title="s",defval=90)
p=input(title="p",type=float,defval=.9,step=.1)

sa=sma(close,s)
plot(sa,color=red,linewidth=3)
band=stdev(close,s)*p
plot(band+sa,color=lime,title="")
plot(-band+sa,color=lime,title="")

// ===Strategy Orders============================================= ========
inpTakeProfit = input(defval = 0, title = "Take Profit", minval = 0)
inpStopLoss = input(defval = 0, title = "Stop Loss", minval = 0)
inpTrailStop = input(defval = 0, title = "Trailing Stop Loss", minval = 0)
inpTrailOffset = input(defval = 0, title = "Trailing Stop Loss Offset", minval = 0)
useTakeProfit = inpTakeProfit >= 1 ? inpTakeProfit : na
useStopLoss = inpStopLoss >= 1 ? inpStopLoss : na
useTrailStop = inpTrailStop >= 1 ? inpTrailStop : na
useTrailOffset = inpTrailOffset >= 1 ? inpTrailOffset : na

longCondition = crossover(close,sa+band) and rising(sa,5)
shortCondition = crossunder(close,sa-band) and falling(sa,5)
crossmid = cross(close,sa)


strategy.entry(id = "Long", long=true, when = longCondition)
strategy.close(id = "Long", when = shortCondition)
strategy.entry(id = "Short", long=false, when = shortCondition)
strategy.close(id = "Short", when = longCondition)
strategy.exit("Exit Long", from_entry = "Long", profit = useTakeProfit, loss = useStopLoss, trail_points = useTrailStop, trail_offset = useTrailOffset, when=crossmid)
strategy.exit("Exit Short", from_entry = "Short", profit = useTakeProfit, loss = useStopLoss, trail_points = useTrailStop, trail_offset = useTrailOffset, when=crossmid)
More
- Dual Moving Average Bollinger Band Trend Tracking Strategy
- Sentiment Based XBT Futures Trading Strategy
- Parabolic SAR Momentum Reversal Strategy
- Empirical Mode Decomposition Based Quantitative Trading Strategy
- Dynamic Pyramiding Strategy
- YinYang RSI Volume Trend Trading Strategy
- Quad MA Trend Scalper Strategy
- Oscillator Index Transformation Strategy
- Golden Cross Dead Cross Dual Moving Average MACD Trend Tracking Strategy
- This is an experimental quantitative trading strategy
- The RSI breakout strategy is a quantitative trading strategy
- The moving average crossover strategy is a quantitative trading strategy
- Momentum Breakout Moving Average Trading Strategy
- Slow Heiken Ashi Exponential Moving Average Trading Strategy
- High-Performance Algorithmic Trading Strategy Based on Quantitative Models
- Bollinger Momentum Breakout Strategy
- Parabolic SAR and EMA Trend Tracking Strategy
- Broken High/Low Strategy
- Low Pyramid Risk Tracking Strategy
- TSLA Quantitative Trading System Across Multiple Timeframes