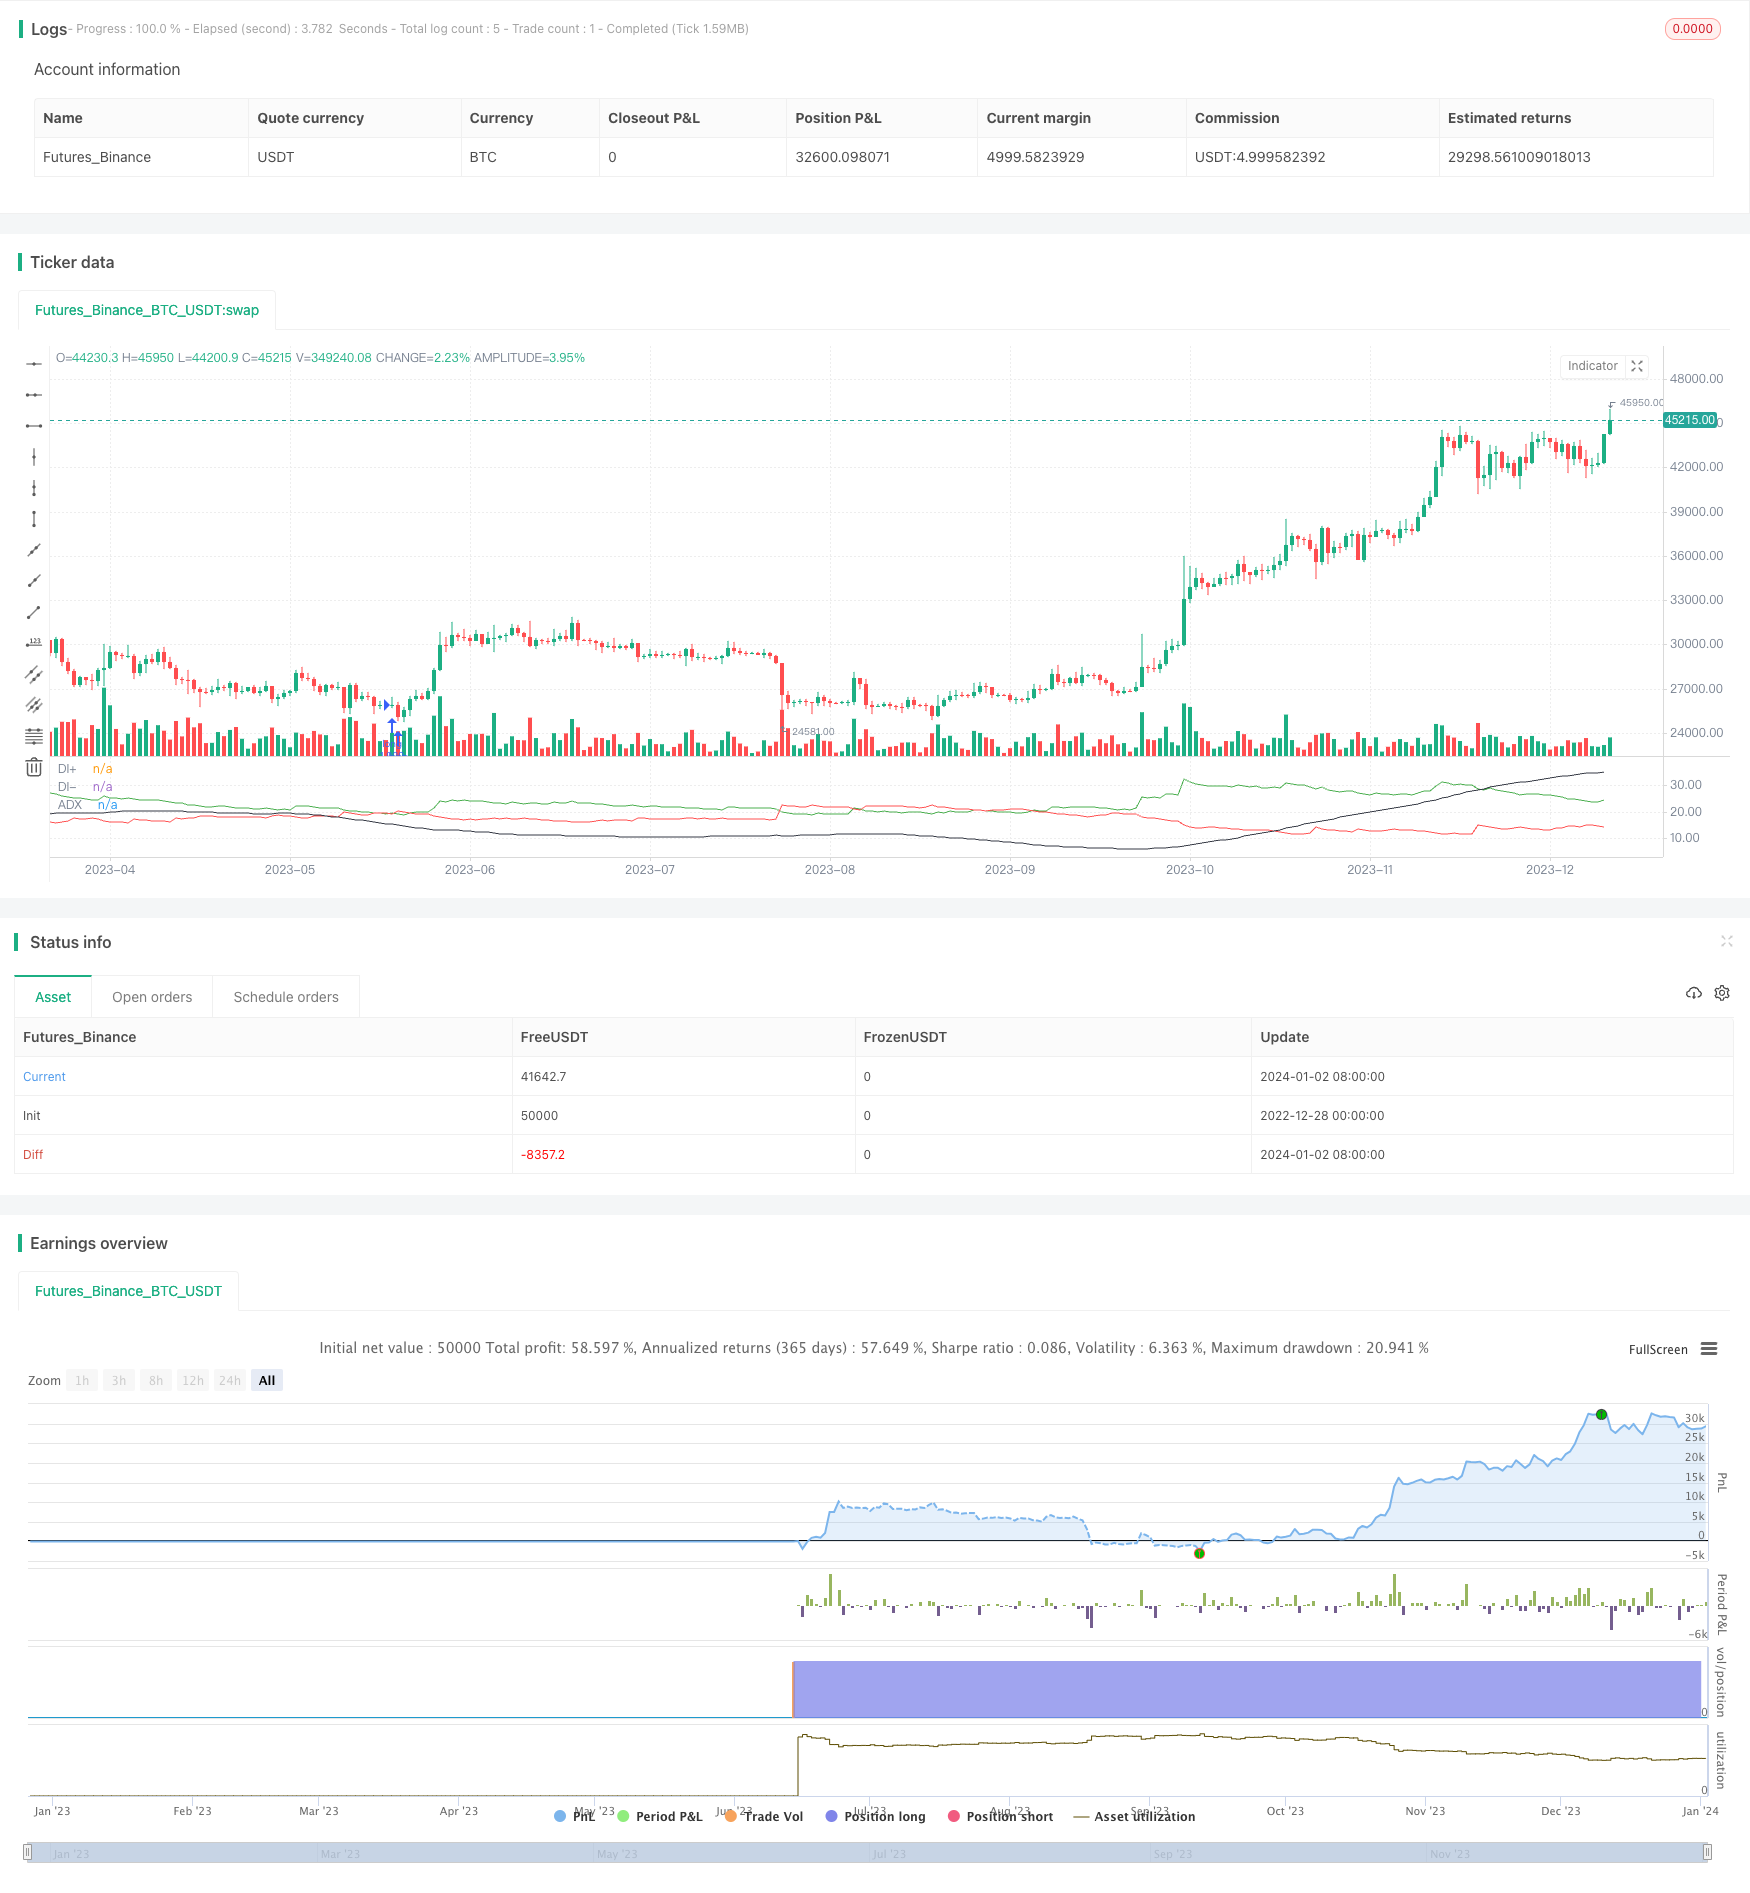
Overview
This strategy combines Directional Movement Index (DMI) and Hull Moving Average (HMA) to identify market direction with DMI and confirm trend strength with HMA, without risk management.
Strategy Logic
Calculate True Range, DIPlus, DIMinus and ADX.
Calculate fast and slow Hull Moving Averages (HMA).
Trigger long entry when DIPlus crosses over DIMinus and fast HMA crosses over slow HMA.
Trigger short entry when DIMinus crosses below DIPlus and fast HMA crosses below slow HMA.
Place long/short orders upon entry signals.
Advantage Analysis
The double confirmation from trend indicator DMI and Hull MA ensures accuracy in capturing market trend and avoids whipsaws. The absence of risk management reduces trading frequency and leads to overall profitability in long run.
Risk Analysis
The key risk comes from no stop loss, failing to control losses when huge market swings happen. Also the limited tuning space and weak adaptiveness are deficiencies.
Possible solutions include adding moving stop loss, optimizing parameter mix etc.
Optimization Directions
Add ATR trailing stop loss based on True Range.
Optimize Hull periods to find best mix.
Dynamic threshold for long/short signals.
Add momentum filter to ensure trend continuity.
Summary
The DMI and HMA combination performs outstandingly in identifying trends with simplicity and efficiency. With proper stop loss and parameter tuning, it can become a great trend following system.
/*backtest
start: 2022-12-28 00:00:00
end: 2024-01-03 00:00:00
period: 1d
basePeriod: 1h
exchanges: [{"eid":"Futures_Binance","currency":"BTC_USDT"}]
*/

// This source code is subject to the terms of the Mozilla Public License 2.0 at https://mozilla.org/MPL/2.0/
// © Tuned_Official
//@version=4
strategy(title="DMI + HMA - No Risk Management", overlay = false, pyramiding=1, default_qty_type=strategy.percent_of_equity, default_qty_value=100, commission_type=strategy.commission.percent, commission_value=0.025)

//Inputs
hullLen1 = input(title="Hull 1 length", type=input.integer, defval=29)
hullLen2 = input(title="Hull 2 length", type=input.integer, defval=2)
len = input(title="Length for DI", type=input.integer, defval=76)

//Calculations
TrueRange = max(max(high-low, abs(high-nz(close[1]))), abs(low-nz(close[1])))
DirectionalMovementPlus = high-nz(high[1]) > nz(low[1])-low ? max(high-nz(high[1]), 0): 0
DirectionalMovementMinus = nz(low[1])-low > high-nz(high[1]) ? max(nz(low[1])-low, 0): 0

SmoothedTrueRange = 0.0
SmoothedTrueRange := nz(SmoothedTrueRange[1]) - (nz(SmoothedTrueRange[1])/len) + TrueRange
SmoothedDirectionalMovementPlus = 0.0
SmoothedDirectionalMovementPlus := nz(SmoothedDirectionalMovementPlus[1]) - (nz(SmoothedDirectionalMovementPlus[1])/len) + DirectionalMovementPlus
SmoothedDirectionalMovementMinus = 0.0
SmoothedDirectionalMovementMinus := nz(SmoothedDirectionalMovementMinus[1]) - (nz(SmoothedDirectionalMovementMinus[1])/len) + DirectionalMovementMinus

//Indicators
fasthull = hma(close, hullLen1)
slowhull = hma(close, hullLen2)
DIPlus = SmoothedDirectionalMovementPlus / SmoothedTrueRange * 100
DIMinus = SmoothedDirectionalMovementMinus / SmoothedTrueRange * 100
DX = abs(DIPlus-DIMinus) / (DIPlus+DIMinus)*100
ADX = sma(DX, len)

//Plots
plot(DIPlus, color=color.green, title="DI+")
plot(DIMinus, color=color.red, title="DI-")
plot(ADX, color=color.black, title="ADX")

//conditions
go_long = crossover(DIPlus, DIMinus) and fasthull > slowhull //crossover(fasthull, slowhull) and DIPlus > DIMinus
go_short = crossover(DIMinus, DIPlus) and fasthull < slowhull //crossunder(fasthull, slowhull) and DIMinus > DIPlus

//Entry
if strategy.position_size < 0 or strategy.position_size == 0
    strategy.order("long", strategy.long, when=go_long)

if strategy.position_size > 0 or strategy.position_size == 0
    strategy.order("Short", strategy.short, when=go_short)