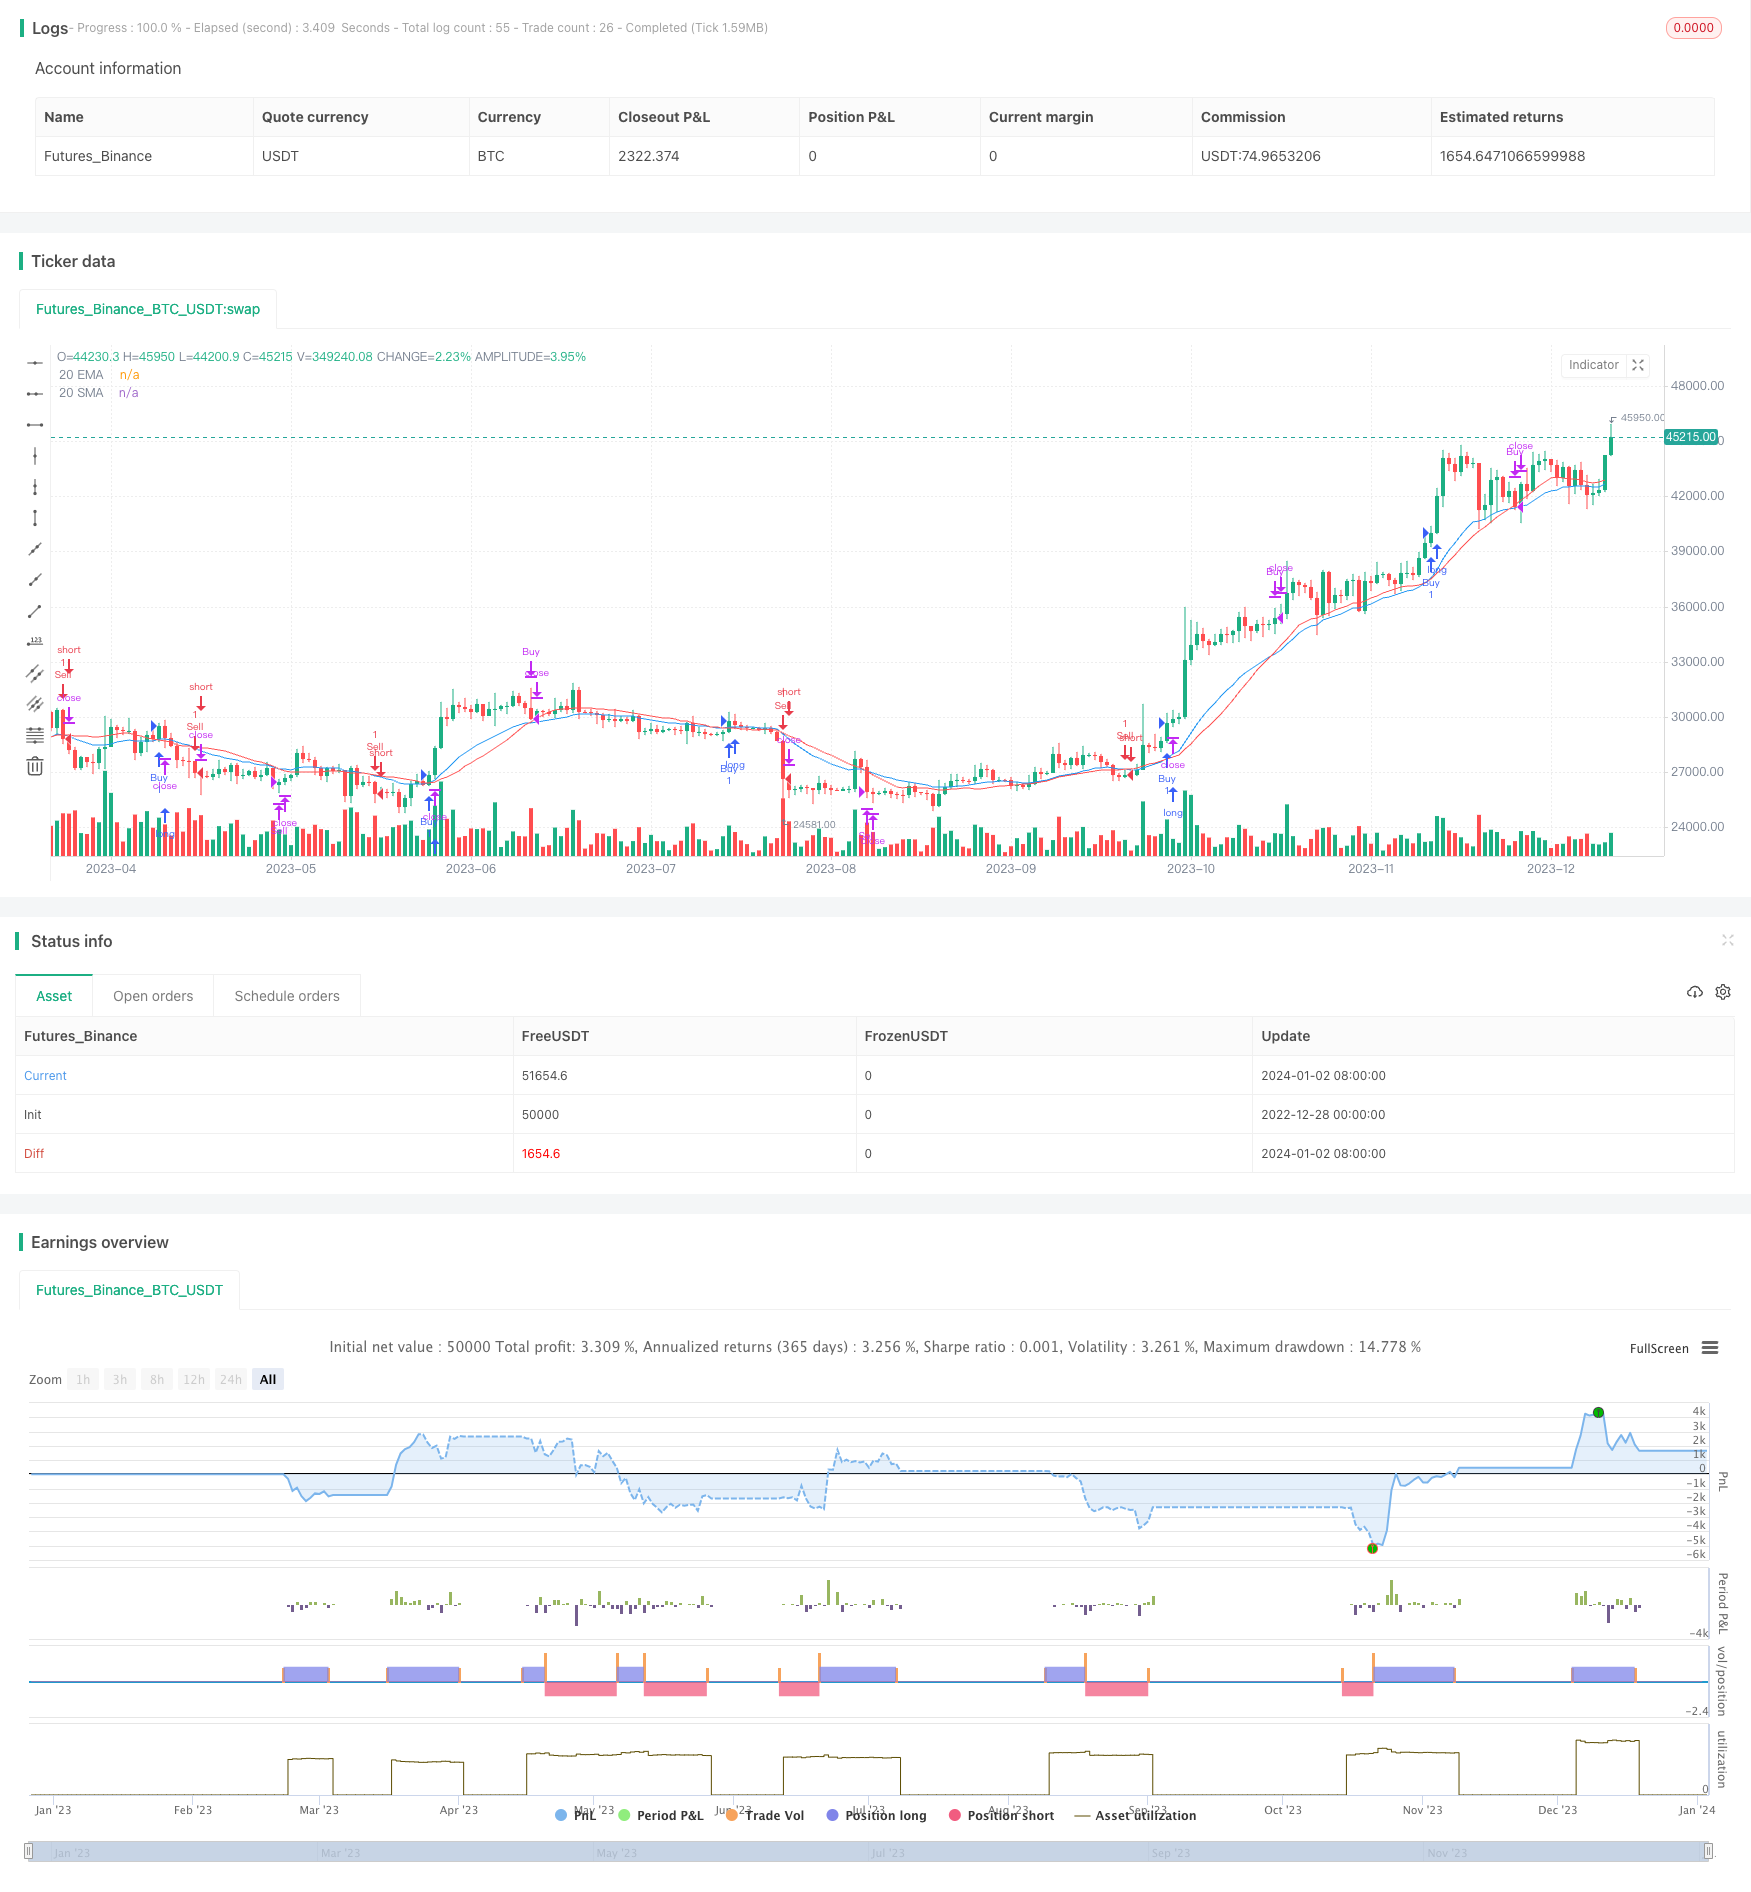
Trend Reversal Strategy Based on EMA and SMA Crossover
Author: ChaoZhang, Date: 2024-01-04 17:59:04Tags:

Overview
The purpose of this strategy is to identify potential trend reversal points by observing the crossover between the 20-period Exponential Moving Average (EMA) and the 20-period Simple Moving Average (SMA). It decides to go long or go short based on the direction of the crossover.
Strategy Logic
- When the 20-period EMA crosses above the 20-period SMA and the closing price is above the 20-period EMA, go long.
- When the 20-period EMA crosses below the 20-period SMA and the closing price is below the 20-period EMA, go short.
- For long positions, close the trade when the 20-period EMA crosses below the 20-period SMA.
- For short positions, close the trade when the 20-period EMA crosses above the 20-period SMA.
The strategy uses the crossover and crossunder functions from the ta library to detect moving average crossovers.
Advantage Analysis
The strategy combines the trend following capability of moving averages and the signal generation of crossover events, having the following advantages:
- Moving averages can effectively filter out some market noise and identify medium-to-long term trends.
- Crossovers are easy to operate and clearly identify turns in market momentum.
- The 20-period parameter works well for most stocks and timeframes without needing frequent adjustment.
- Using the closing price in relation to the EMA avoids some false signals.
- The rules are simple and easy to understand, suitable for less sophisticated investors.
Risk Analysis
The strategy also has the following risks:
- Moving averages have lag and may miss short-term, abrupt trend reversals.
- Crossovers can generate noisy signals, impacting stability.
- The fixed 20-period parameter may not work well for some stocks, needing tuning.
- There is no stop loss, allowing large losing trades.
Solutions:
- Shorten the moving average periods to increase responsiveness.
- Add filters to avoid false signals.
- Test and optimize parameters and stock categories.
- Incorporate stop loss to control risk.
Optimization Directions
The strategy can also be improved in the following aspects:
- Add other indicators to build a composite strategy, e.g. volume, RSI.
- Test and optimize periods and symbols, set adaptive parameters.
- Build dynamic exit mechanisms like trailing stop loss, time-based stop loss.
- Add algorithmic trading capabilities for automation.
- Incorporate machine learning for adaptive optimization.
Summary
The strategy is relatively simple and practical overall, identifying potential trend reversal points through moving average crossover theory. But there is also room for improvement via additional indicators, dynamic parameters, stop losses, algorithmic trading etc. to make the strategy more robust, reliable and automated. In summary, it provides a good template for getting started with quantitative trading.
/*backtest
start: 2022-12-28 00:00:00
end: 2024-01-03 00:00:00
period: 1d
basePeriod: 1h
exchanges: [{"eid":"Futures_Binance","currency":"BTC_USDT"}]
*/

//@version=5
strategy("EMA-SMA Crossover Strategy", overlay=true)

// Define the length of the moving averages
emaLength = 20
smaLength = 20

// Calculate moving averages
emaValue = ta.ema(close, emaLength)
smaValue = ta.sma(close, smaLength)

// Buy condition
buyCondition = ta.crossover(emaValue, smaValue) and close > emaValue

// Short sell condition
sellCondition = ta.crossunder(emaValue, smaValue) and close < emaValue

// Exit conditions for both Buy and Short sell
exitBuyCondition = ta.crossunder(emaValue, smaValue)
exitSellCondition = ta.crossover(emaValue, smaValue)

// Strategy logic
if (buyCondition)
    strategy.entry("Buy", strategy.long)

if (sellCondition)
    strategy.entry("Sell", strategy.short)

if (exitBuyCondition)
    strategy.close("Buy")

if (exitSellCondition)
    strategy.close("Sell")

// Plot the moving averages
plot(emaValue, color=color.blue, title="20 EMA")
plot(smaValue, color=color.red, title="20 SMA")
- Simple Trend Following Strategy
- Long Breakthrough Strategy Based on K-Line Construction
- Momentum Oscillating Moving Average Trading Strategy Based on Buffered Bollinger Bands
- Adaptive Backtest Date Range Selection Strategy Based on Double MA
- Multi-Timeframe Moving Average Crossover Optimization Strategy
- Breakthrough Tracking Strategy
- Adaptive Trading Strategy Based on Momentum Indicators
- Pivot Point and Fibonacci Retracement Based Automatic Trend Following Strategy
- Trend Following Strategy Based on EMA and MACD across Timeframes
- Multi-indicator Collision Reversal Strategy
- DMI DPO Guard Strategy
- Trend Tracking Short-term Trading Strategy
- RSI Trend Following Bull Strategy
- RSIndex and Moving Average Combination Strategy
- Multi-timeframe MA Trend Following Strategy
- Dual Indicators Bottom Buying Strategy
- Bearish Engulfing Reversal Strategy
- Trend and Oscillation Double Strategy
- TrendSurfing - Double Moving Average Crossover Trend Strategy
- DMI and HMA Combination Strategy