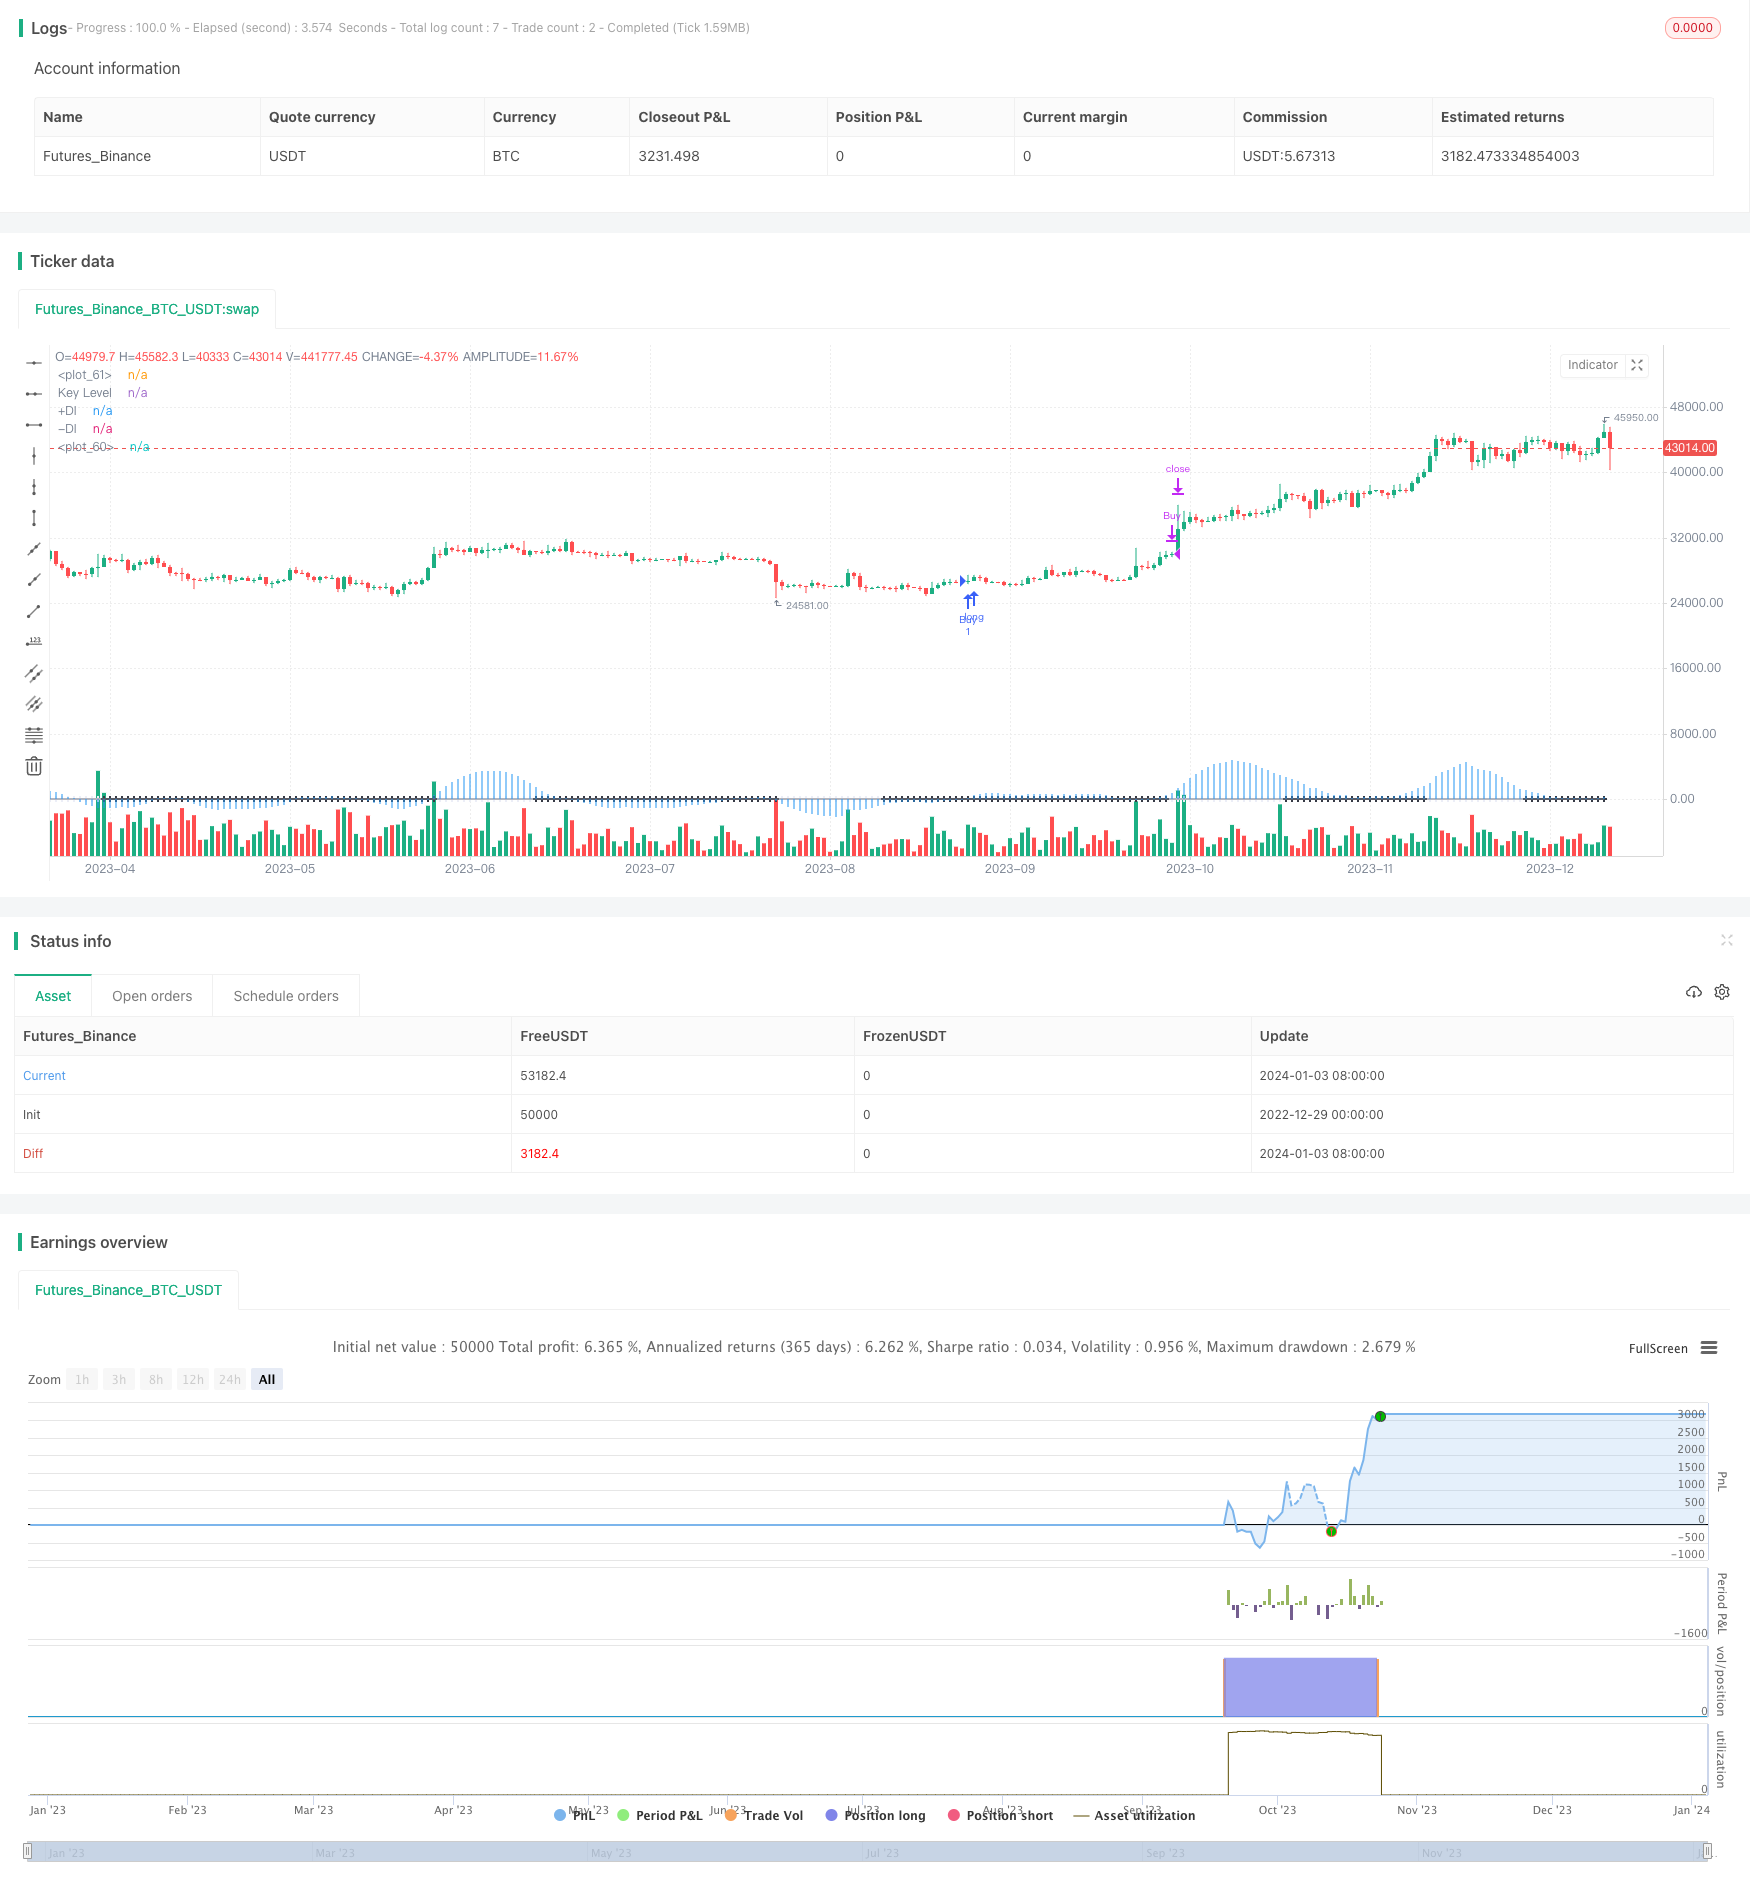
Adaptive Trading Strategy Based on Momentum Indicators
Author: ChaoZhang, Date: 2024-01-05 11:43:25Tags:

Overview
This strategy is an adaptive stock trading strategy based on momentum indicators. It integrates Bollinger Bands, Keltner Channels and price squeeze indicator to achieve trend judgment, breakthrough point identification and stop-loss exit for automated trading.
Strategy Principle
The core of this strategy is to build a price channel through Bollinger Bands and Keltner Channels and identify trading signals when price breaks through the channel. It will take long position when price breaks up the channel and take short position when price breaks down the channel. In addition, when price is squeezed in the channel, the strategy will determine the operation direction based on the positive and negative value of the price squeeze indicator.
Specifically, Bollinger Bands calculates standard deviation of price to plot the upper and lower rail; Keltner Channels plots the upper and lower rail based on average price ± average volatility range. When channel fusion happens between the two, it is considered that the market enters consolidation while waiting for the next breakout. The price squeeze indicator reflects whether the price is compressed between the two channels. The strategy determines the market direction based on the positive and negative value of the squeeze indicator.
In summary, this strategy integrates multiple indicators to judge the price movement and form a clear long and short logic, which can effectively filter false breakouts and identify high probability trading opportunities.
Advantages of the Strategy
-
Integrates multiple indicators with strong judgment capability. The combination of indicators can improve accuracy.
-
Squeeze indicator difference to determine, reduce false breakout. The indicator difference serves as an auxiliary condition to avoid unnecessary trading.
-
Adaptive channel stop loss, effectively manage risks. The channel serves as the stop-loss position, which can adjust automatically based on market fluctuation to reduce losses.
-
Simple parameter settings, suitable for automation. With only a few key parameters, it is easy to test, optimize and integrate into automated trading systems.
Risks of the Strategy
-
Frequent long-short switch when market fluctuates sharply, leading to increased number of trades.
-
Improper indicator parameters may miss good trading opportunities. Requires sufficient testing and optimization to find the optimal parameters.
-
Only applicable to stocks with a clear direction, not suitable for extremely volatile markets. Indicators can be easily misguided and produce false signals.
Optimization Directions
-
Increase position control module to optimize capital utilization efficiency. For example, allocate capital based on the breakout strength.
-
Increase machine learning model to dynamically adjust indicator parameters, allowing indicators to automatically adapt to different cycles and different stocks.
-
Enhance the stop loss strategy by introducing more auxiliary indicators to determine the stop loss timing. Improved strategy can reduce the number of stop losses at key points.
Conclusion
This strategy integrates Bollinger Bands, Keltner Channels and price squeeze indicator to form a clear logic for judgement and risk control system. It combines trend judgment and breakout operations, can automatically adapt to market conditions and identify high probability trading opportunities. With further parameter optimization and auxiliary conditions improvement, this strategy can be further strengthened into an important tool for quantitative trading.
/*backtest
start: 2022-12-29 00:00:00
end: 2024-01-04 00:00:00
period: 1d
basePeriod: 1h
exchanges: [{"eid":"Futures_Binance","currency":"BTC_USDT"}]
*/

// This Pine Script™ code is subject to the terms of the Mozilla Public License 2.0 at https://mozilla.org/MPL/2.0/
// © juliopetronilo

//@version=4
strategy("DMI/ADX/Squeeze Robot", shorttitle="DMI/ADX/SQZ", overlay=true)

// Squeeze Momentum Indicator
length = input(20, title="BB Length")
mult = input(2.0, title="BB MultFactor")
lengthKC = input(20, title="KC Length")
multKC = input(1.5, title="KC MultFactor")
useTrueRange = input(true, title="Use TrueRange (KC)")

source = close
basis = sma(source, length)
dev = multKC * stdev(source, length)
upperBB = basis + dev
lowerBB = basis - dev

ma = sma(source, lengthKC)
rangeKC = useTrueRange ? tr : (high - low)
rangema = sma(rangeKC, lengthKC)
upperKC = ma + rangema * multKC
lowerKC = ma - rangema * multKC

sqzOn = (lowerBB > lowerKC) and (upperBB < upperKC)
sqzOff = (lowerBB < lowerKC) and (upperBB > upperKC)
noSqz = not (sqzOn or sqzOff)

val = linreg(source - avg(avg(highest(high, lengthKC), lowest(low, lengthKC)), sma(close, lengthKC)), lengthKC, 0)

// DMI/ADX Plot
adxlen = input(14, title="ADX Smoothing")
dilen = input(14, title="DI Length")
keyLevel = input(23, title="Key Level for ADX")

dirmov(len) =>
    up = change(high)
    down = -change(low)
    truerange = rma(tr, len)
    plus = fixnan(100 * rma(up > down and up > 0 ? up : 0, len) / truerange)
    minus = fixnan(100 * rma(down > up and down > 0 ? down : 0, len) / truerange)
    [plus, minus]

adx(dilen, adxlen) =>
    [plus, minus] = dirmov(dilen)
    sum = plus + minus
    adx_val = abs(plus - minus) / (sum == 0 ? 1 : sum) * 100
    [adx_val, plus, minus]

[sig, up, down] = adx(dilen, adxlen)

// Estrategia de Trading
strategy.entry("Buy", strategy.long, when=sqzOn and crossover(up, down) and crossover(val, 0))
strategy.entry("Sell", strategy.short, when=sqzOn and crossunder(up, down) and crossunder(val, 0))
strategy.close("Buy", when=sqzOff)
strategy.close("Sell", when=sqzOff)

// Plot de los indicadores
plot(val, color=color.blue, style=plot.style_histogram, linewidth=4)
plot(0, color=noSqz ? color.blue : sqzOn ? color.black : color.rgb(236, 238, 247), style=plot.style_cross, linewidth=2)
plot(up, color=color.blue, title="+DI")
plot(down, color=color.gray, title="-DI")
plot(keyLevel, color=color.white, title="Key Level")
- Ichimoku Cloud Quantitative Trading Strategy
- Trend Following Moving Average Trading Strategy
- Trend Following Momentum Breakout Strategy
- Breakout and Intelligent Bollinger Bands Price Channel Strategy
- Simple Trend Following Strategy
- Long Breakthrough Strategy Based on K-Line Construction
- Momentum Oscillating Moving Average Trading Strategy Based on Buffered Bollinger Bands
- Adaptive Backtest Date Range Selection Strategy Based on Double MA
- Multi-Timeframe Moving Average Crossover Optimization Strategy
- Breakthrough Tracking Strategy
- Pivot Point and Fibonacci Retracement Based Automatic Trend Following Strategy
- Trend Following Strategy Based on EMA and MACD across Timeframes
- Multi-indicator Collision Reversal Strategy
- Trend Reversal Strategy Based on EMA and SMA Crossover
- DMI DPO Guard Strategy
- Trend Tracking Short-term Trading Strategy
- RSI Trend Following Bull Strategy
- RSIndex and Moving Average Combination Strategy
- Multi-timeframe MA Trend Following Strategy
- Dual Indicators Bottom Buying Strategy