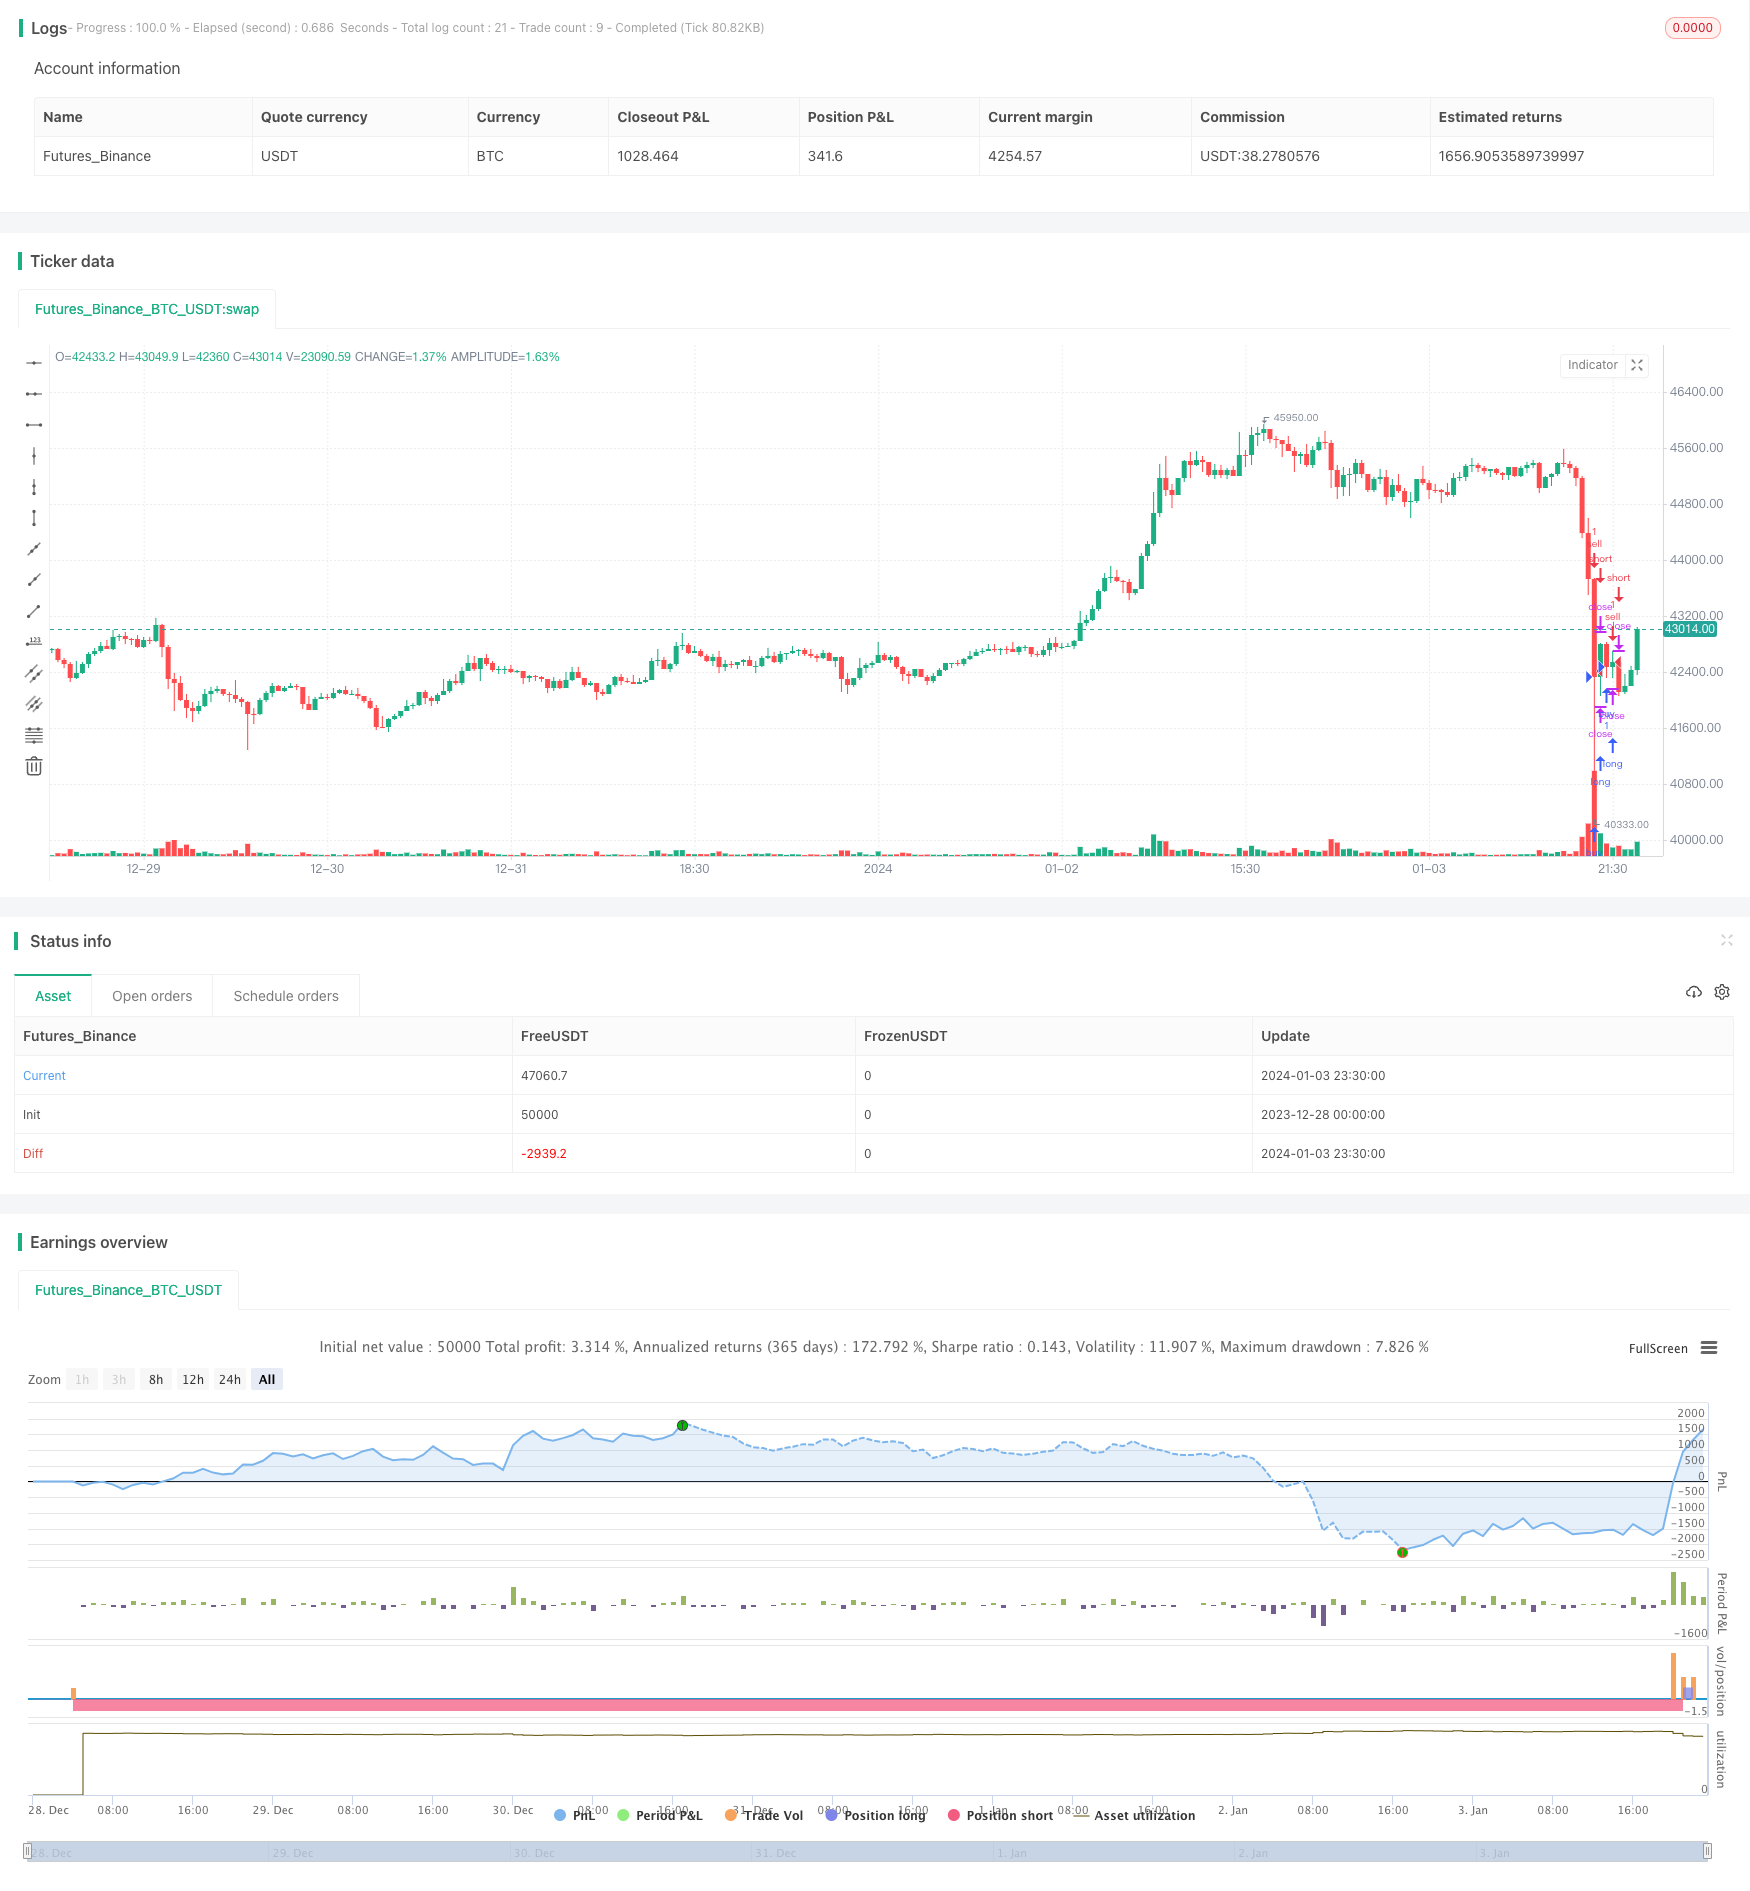
Price Drop Buy Strategy in Downtrend with Stop Loss
Author: ChaoZhang, Date: 2024-01-05 14:18:05Tags:

Overview
This strategy uses the RSI indicator to determine the potential market trend direction, combined with the Bollinger Bands indicator to identify key support and resistance areas, and looks for low absorption opportunities in trend shock markets to establish long positions and take profits at overbought areas.
Strategy Logic
-
Use the RSI indicator to determine the potential market trend direction. RSI below 40 is considered an oversold area where the market could turn bullish. RSI above 50 is considered an overbought area where the market could turn bearish.
-
Use the Bollinger Bands indicator to identify key support and resistance areas. The middle band of Bollinger Bands is the moving average line of price, and the upper and lower bands form the standard deviation channel of price. Prices approaching the lower band present low absorption opportunities.
-
When RSI <40 and price approaches the Bollinger lower band, it is determined as a low absorption long opportunity to establish a long position.
-
When RSI >50 or profits exceed 50%, close long positions to take profits and cut losses.
Advantage Analysis
-
Use RSI to determine potential market trend direction to avoid trading against the trend.
-
Identify precise entry timing combining with Bollinger Bands to locate low absorption points.
-
Adopt trend shock methodology to prevent being trapped.
-
Flexible stop profit and stop loss mechanism to maximize profits.
Risk Analysis
-
Improper Bollinger parameters may fail to correctly locate the support area.
-
Trend breakthroughs or false breakthroughs could lead to errors in overbought and oversold judgements.
-
Improper stop profit and stop loss points setting may lead to premature exit or enlarged losses.
Optimization Directions
-
Optimize Bollinger parameters for more accurate identification of support and resistance areas.
-
Incorporate other indicators like MACD and KDJ to filter false signals.
-
Dynamically optimize stop profit and stop loss algorithms to maximize profits while minimizing losses.
Summary
This strategy determines potential trend direction with RSI, combined with Bollinger Bands to identify support areas, realizing low buy high sell, which is a typical trend shock strategy. With proper optimization, it can become a reliable and stable profitable quantitative strategy.
/*backtest
start: 2023-12-28 00:00:00
end: 2024-01-04 00:00:00
period: 30m
basePeriod: 15m
exchanges: [{"eid":"Futures_Binance","currency":"BTC_USDT"}]
*/

//@version=3
strategy("price drop buy in", overlay=true, initial_capital=1000, max_bars_back=24)

// === INPUT BACKTEST RANGE ===
FromMonth = input(defval = 1, title = "From Month", minval = 1, maxval = 12)
FromDay   = input(defval = 1, title = "From Day", minval = 1, maxval = 31)
FromYear  = input(defval = 2018, title = "From Year", minval = 2017)
ToMonth   = input(defval = 1, title = "To Month", minval = 1, maxval = 12)
ToDay     = input(defval = 1, title = "To Day", minval = 1, maxval = 31)
ToYear    = input(defval = 9999, title = "To Year", minval = 2017)

// === FUNCTION EXAMPLE ===
start     = timestamp(FromYear, FromMonth, FromDay, 00, 00)  // backtest start window
finish    = timestamp(ToYear, ToMonth, ToDay, 23, 59)        // backtest finish window
window()  => true // create function "within window of time"


///////////// RSI
RSIlength = input(60,title="RSI Period Length")
RSIoverSold = 40
RSIoverBought = 50
price = close
vrsi = rsi(close, RSIlength)

smaLong = sma(close,80)
smaShort = sma(close,40)

///////////// Bollinger Bands
BBlength = input(20, minval=1,title="Bollinger Period Length")
BBmult = 2 // input(2.0, minval=0.001, maxval=50,title="Bollinger Bands Standard Deviation")
BBbasis = sma(price, BBlength)
BBdev = BBmult * stdev(price, BBlength)
BBupper = BBbasis + BBdev
BBlower = BBbasis - BBdev

longcondition = (price < BBlower and vrsi < RSIoverSold)

    // vrsi < RSIoverSold

shortcondition = (RSIoverBought and strategy.openprofit > 50 )  or price > BBupper


if(longcondition)
    strategy.entry('buy', strategy.long, when = window())

if(shortcondition)
    strategy.entry('sell', strategy.short, when = window())
- Improved RSI MACD Moving Average Strategy
- Merged Short Term and Long Term EMA Decision Strategy
- Chandelier Exit Strategy
- The Momentum Driven Triple Confirmation Trend Following Strategy
- Fisher Turnaround EMA Multi-Take Profit and Multi-Stop Strategy
- Moving Average System Trading Strategy
- MACD Crossover Trading Strategy
- Visual Comparison between Strategy and Buy & Hold Returns
- Reversal Tracking Strategy with Double Mechanisms
- Golden Ratio Moving Average Trading Strategy
- Reversal Momentum Compound Strategy
- Quantitative Trading Strategy Based on EMA Crossover
- Ichimoku Cloud Quantitative Trading Strategy
- Trend Following Moving Average Trading Strategy
- Trend Following Momentum Breakout Strategy
- Breakout and Intelligent Bollinger Bands Price Channel Strategy
- Simple Trend Following Strategy
- Long Breakthrough Strategy Based on K-Line Construction
- Momentum Oscillating Moving Average Trading Strategy Based on Buffered Bollinger Bands
- Adaptive Backtest Date Range Selection Strategy Based on Double MA