RSI Trend Tracking Long Only Strategy
Author: ChaoZhang, Date: 2024-01-05 16:19:57Tags:

Overview
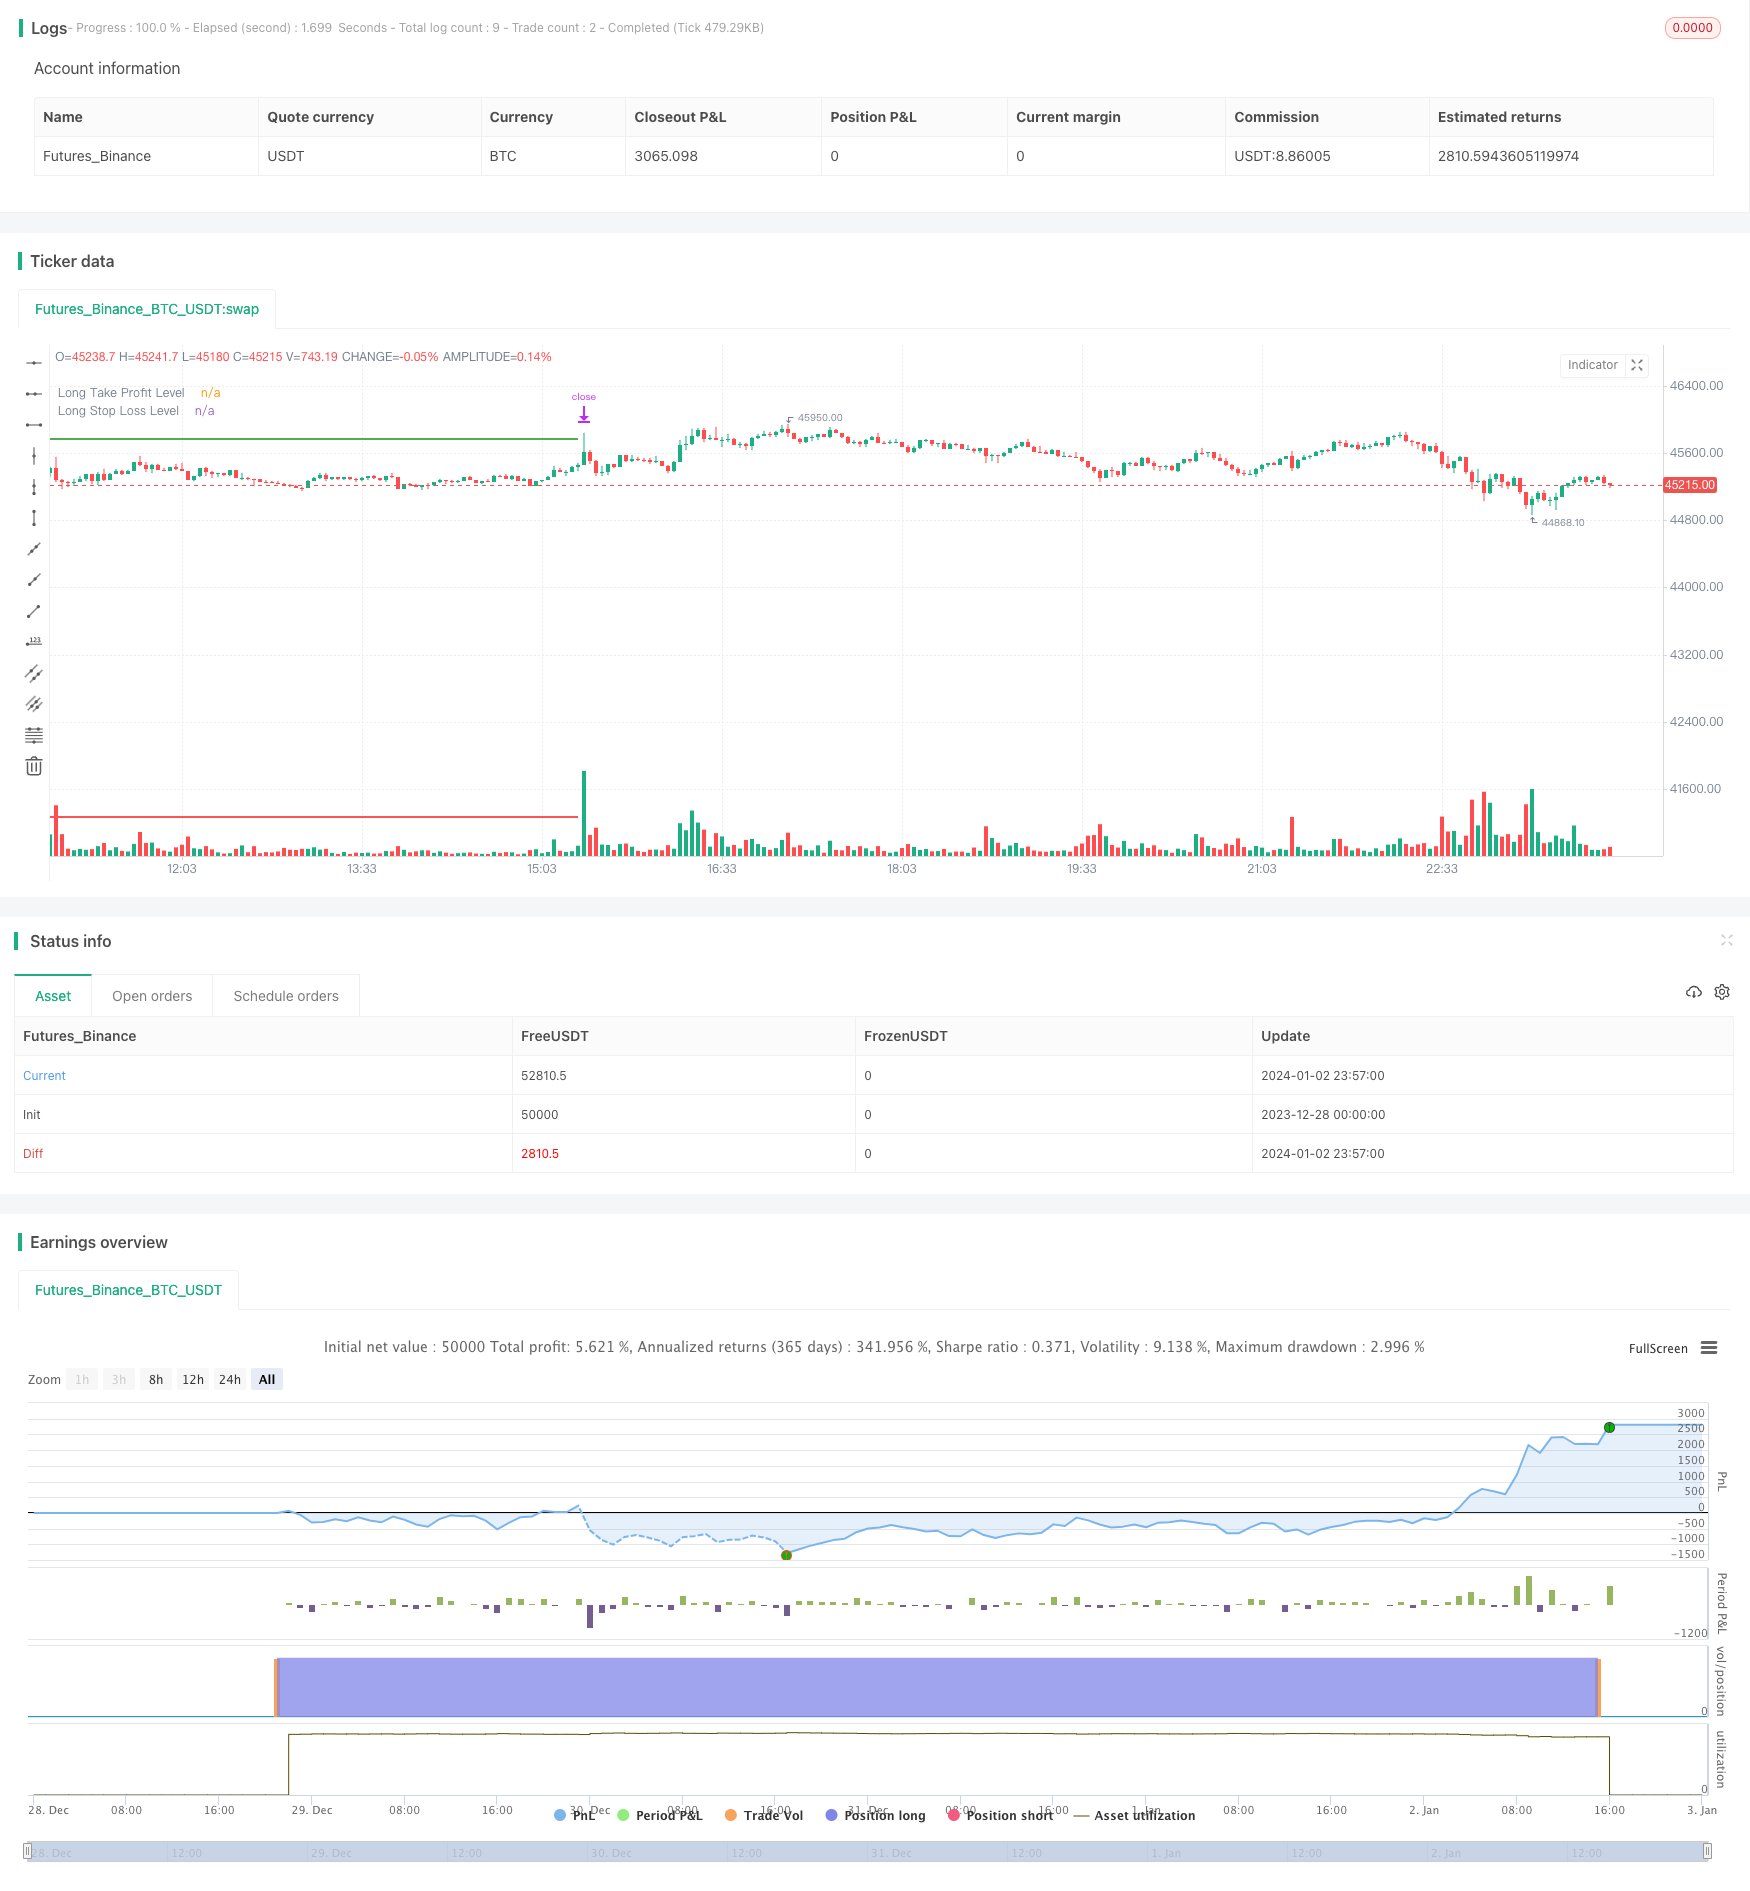
This strategy implements a long only trend tracking strategy based on the RSI indicator. It goes long when RSI reaches oversold level and adopts fixed take profit and stop loss ratios. The strategy is simple and straightforward, suitable for bull market.
Strategy Logic
The strategy uses RSI indicator to determine entry signals. It goes long when RSI drops below the oversold level of 25. After entering, fixed take profit and stop loss levels are set based on entry price. Specifically, take profit level is 7% above entry price and stop loss level is 3.5% below entry price.
The strategy only goes long and does not go short. It is a trend tracking strategy. It aims to capture the upward trend after the price bounces back from oversold RSI levels. When RSI is oversold, it indicates the price may have short term overselling. Going long at this point can benefit from the rebound.
Advantage Analysis
The advantages of this strategy are:
-
The logic is clear and simple, easy to understand and implement.
-
It only goes long, avoiding risks associated with regularity FD003.
-
Long signals come from RSI indicator, which effectively identifies oversold reversal opportunities.
-
Adopting fixed take profit/stop loss ratios controls single trade loss.
Risk Analysis
There are also some risks with this strategy:
-
It works better in bull market and cannot profit in bear market.
-
It misses opportunities to enter on new high breakouts.
-
Fixed stop loss ratio cannot adapt to changing market volatility.
-
Improper RSI parameter settings may lead to overtrading or insufficient signals.
Improvement Areas
The strategy can be improved from the following aspects:
-
Adding short side strategy to profit from bear market.
-
Adding new entry conditions like new high breakout or pattern signals to improve accuracy.
-
RSI parameters can be optimized through training to reduce errors.
-
Stop loss mechanism can become more intelligent, combining ATR to adjust based on volatility.
Conclusion
In summary, this strategy has clear logic to go long on oversold RSI levels and track bull trend. Pros are simplicity and straightforwardness while cons are only working for bull market and much room for improvement. It can serve as a baseline long side trend tracking strategy. More conditions, filters and indicators could be introduced to turn it into a reliable positive swing system.
/*backtest
start: 2023-12-28 00:00:00
end: 2024-01-03 00:00:00
period: 3m
basePeriod: 1m
exchanges: [{"eid":"Futures_Binance","currency":"BTC_USDT"}]
*/

//@version=5
strategy("RSI BENI strategy (Long Only)", overlay=true, shorttitle="RSI BENI Long")

length = input(14, title="RSI Length")
overSold = input(25, title="Overbought Level")
price = close
vrsi = ta.rsi(price, length)

// Plot Einstiege und Levels im Chart für überverkaufte Zonen
plotshape(series=strategy.position_avg_price > 0 and vrsi[1] <= overSold and vrsi > overSold,
         title="Long Entry",
         color=color.green,
         style=shape.triangleup,
         size=size.small,
         location=location.belowbar)

long_tp_inp = input(0.07, title='Long Take Profit %')
long_sl_inp = input(0.035, title='Long Stop Loss %')

long_take_level = strategy.position_avg_price * (1 + long_tp_inp)
long_stop_level = strategy.position_avg_price * (1 - long_sl_inp)

plot(long_take_level, color=color.green, title="Long Take Profit Level", linewidth=2)
plot(long_stop_level, color=color.red, title="Long Stop Loss Level", linewidth=2)

if (not na(vrsi))
    if vrsi < overSold
        // Long Entry
        strategy.entry("Long", strategy.long, comment="enter long")

        strategy.exit("Take Profit/Stop Loss", "Long", limit=long_take_level, stop=long_stop_level)
- RSI Dual-track Breakthrough Strategy
- Crude Oil Moving Average Crossover Strategy
- Vertical Horizontal Filter Backtest Strategy
- RSI and Bollinger Bands Quantitative Trading Strategy
- ZigZag Trend Following Strategy
- Supertrend Advance Strategy
- Midnight Candle Color Strategy with Stop Loss and Take Profit
- ATR Trend Following Strategy Based on Standard Deviation Channel
- ATR Based Trend Tracking Strategy
- Quantitative Trading Strategy Combining RSI, MACD and Support/Resistance
- Double Channel Breakthrough Turtle Strategy
- Improved RSI MACD Moving Average Strategy
- Merged Short Term and Long Term EMA Decision Strategy
- Chandelier Exit Strategy
- The Momentum Driven Triple Confirmation Trend Following Strategy
- Fisher Turnaround EMA Multi-Take Profit and Multi-Stop Strategy
- Moving Average System Trading Strategy
- MACD Crossover Trading Strategy
- Visual Comparison between Strategy and Buy & Hold Returns
- Reversal Tracking Strategy with Double Mechanisms