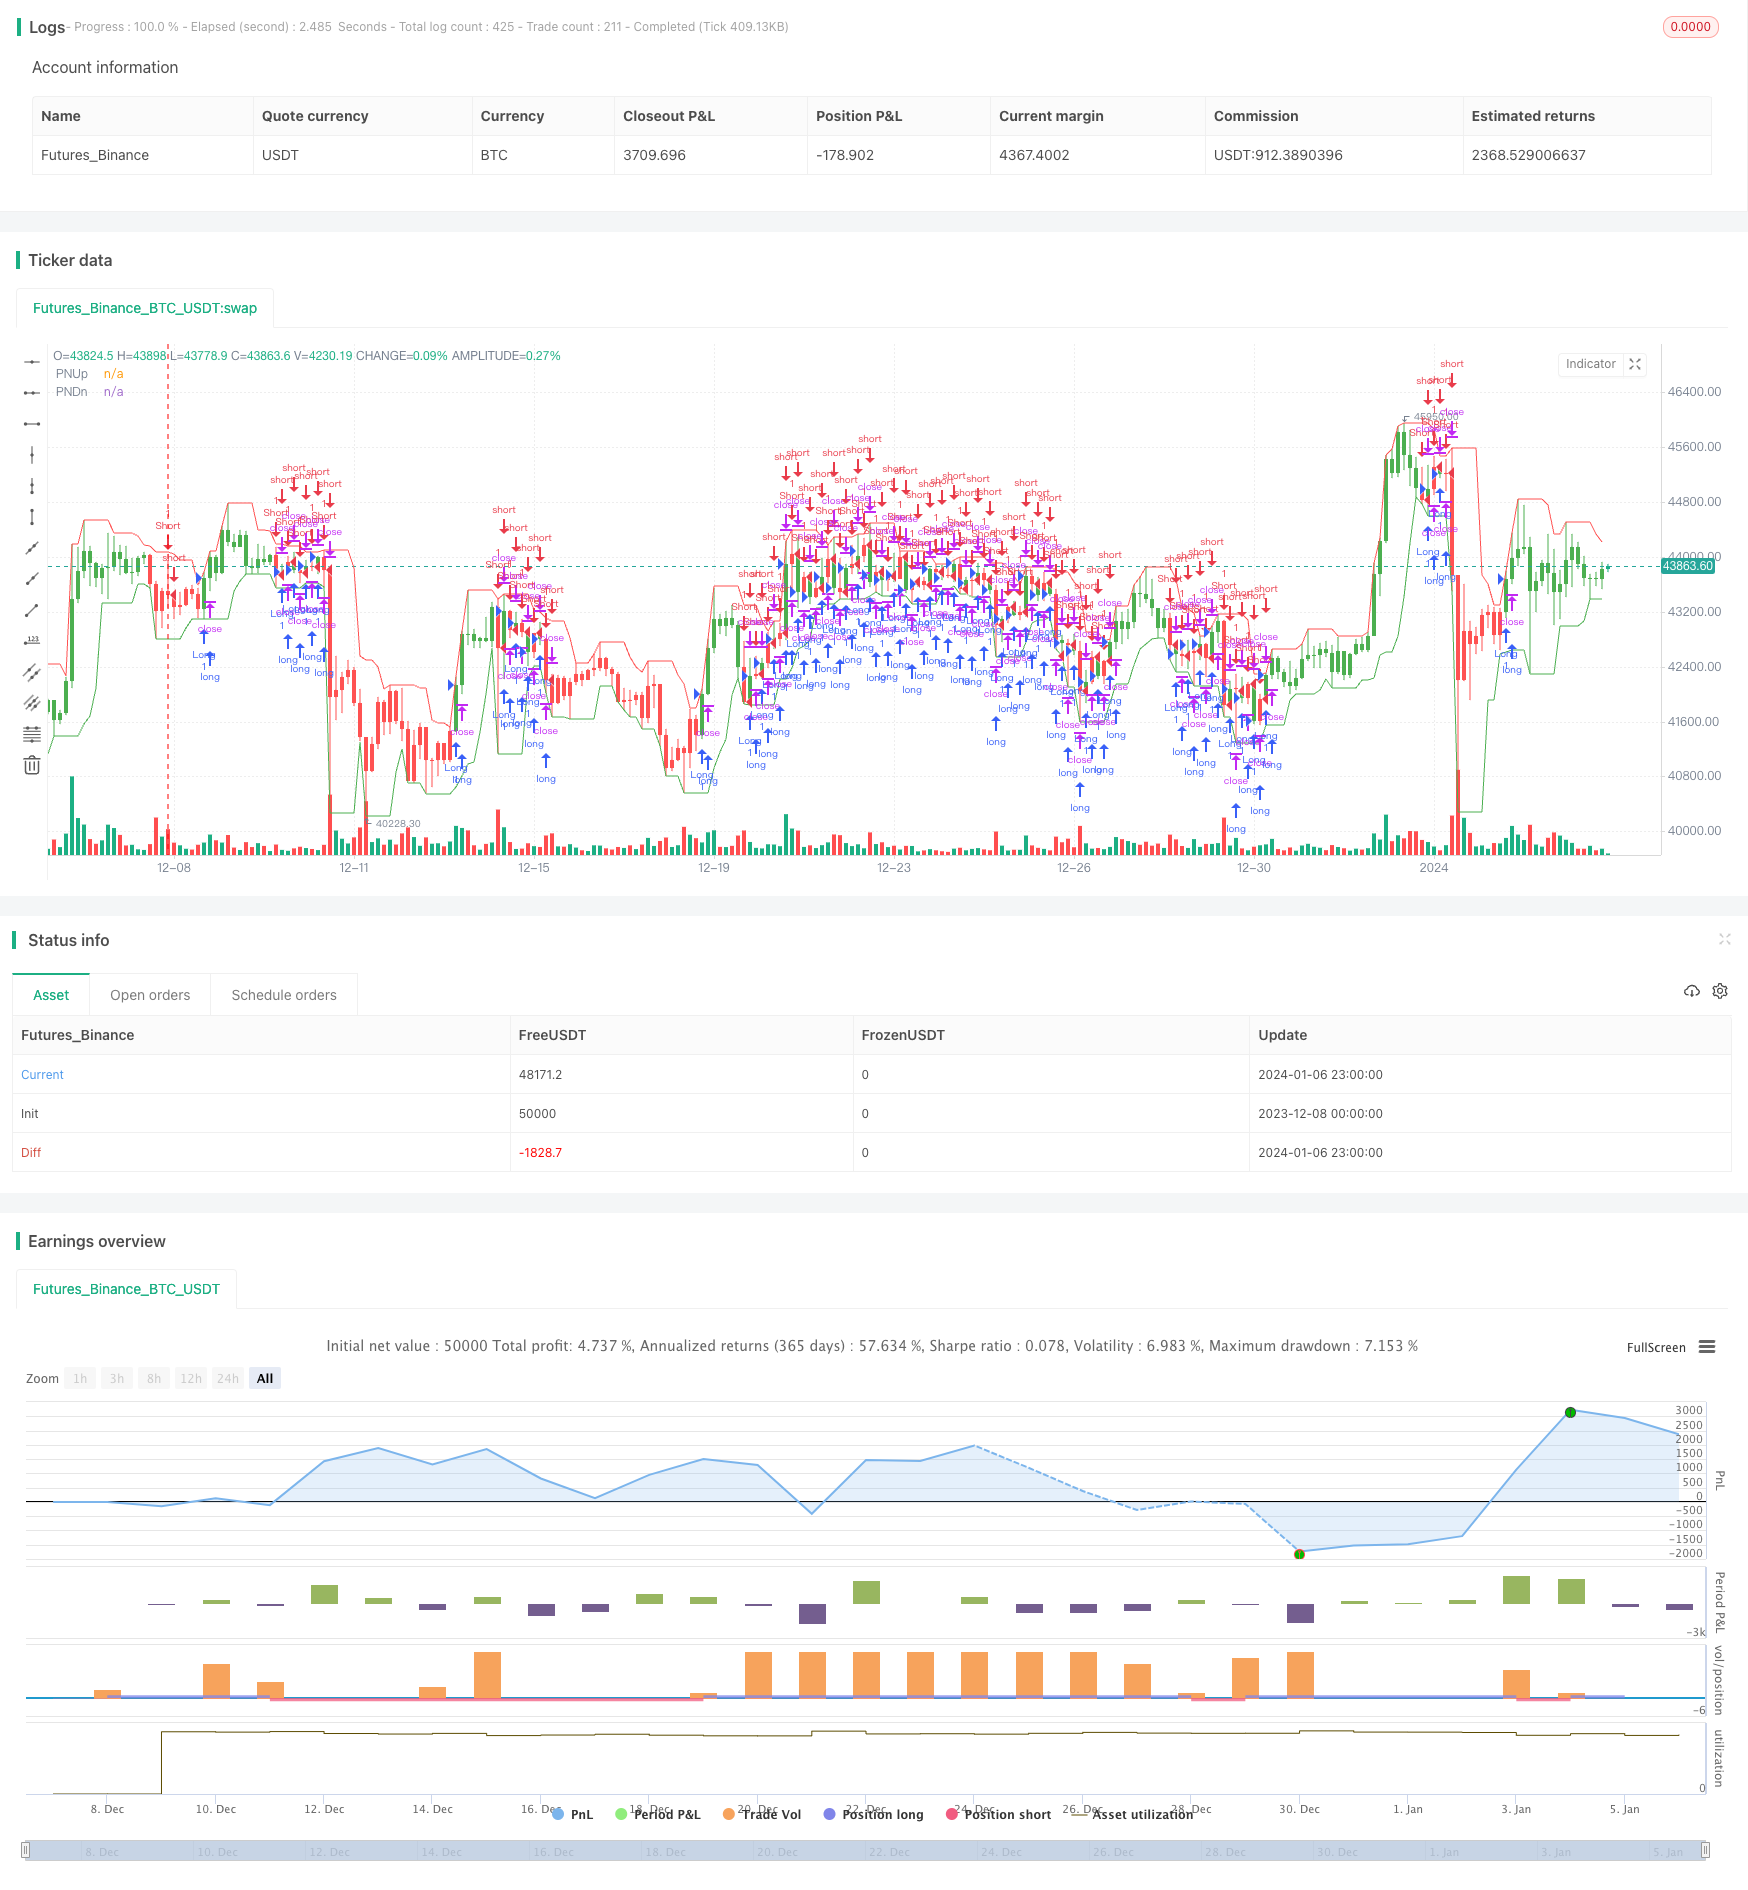
Prime Number Bands Backtest Strategy
Author: ChaoZhang, Date: 2024-01-08 11:54:52Tags:

Overview
The Prime Number Bands backtest strategy judges market trends by identifying the highest and lowest prime numbers around a price and plotting these two prime number series as a band. This strategy was developed by Modulus Financial Engineering Inc.
Strategy Logic
- Traverse a specified price fluctuation range based on the input tolerance percentage to find the highest and lowest prime numbers.
- Use the highest and lowest functions to obtain the highest and lowest points of the prime number bands in the most recent N bars.
- Determine the long or short direction based on whether the closing price breaks through the highest and lowest points of the prime number bands.
- Can choose to reverse trading signals.
Advantage Analysis
- Capture market randomness using the random and irregular distribution characteristics of prime numbers.
- The prime number bands have a certain lag, which can filter out some noise.
- The upper and lower limits of prime number bands are flexible and can be adjusted through the tolerance percentage to adapt to different cycles and different trading varieties.
Risk Analysis
- Prime number bands cannot completely fit the price movement and have a certain degree of lag.
- Price reversals due to extremes could lead to wrong signals.
- Excessive tolerance percentage settings filter out some valid signals.
Risks can be avoided by properly adjusting parameters, combining with other indicators, etc.
Optimization Directions
- Set dual conditions for triggering signals by combining simple moving averages and other indicators.
- Research the use of other random numbers such as Fibonacci numbers.
- Introduce machine learning algorithms to achieve automatic parameter optimization.
Summary
The prime number bands backtest strategy overall is a very innovative strategy with practical value. It uses the characteristics of prime numbers to capture market randomness while also considering price lag in identifying trends, very worthwhile for research. Next steps are to optimize from aspects of improving signal quality, expanding random number types, automatic optimization, etc. to make the strategy effect more remarkable.
/*backtest
start: 2023-12-08 00:00:00
end: 2024-01-07 00:00:00
period: 3h
basePeriod: 15m
exchanges: [{"eid":"Futures_Binance","currency":"BTC_USDT"}]
*/

//@version=2
////////////////////////////////////////////////////////////
//  Copyright by HPotter v1.0 27/03/2018
// Determining market trends has become a science even though a high number
// or people still believe it’s a gambling game. Mathematicians, technicians,
// brokers and investors have worked together in developing quite several
// indicators to help them better understand and forecast market movements.
// The Prime Number Bands indicator was developed by Modulus Financial Engineering
// Inc. This indicator is charted by indentifying the highest and lowest prime number
// in the neighborhood and plotting the two series as a band.
//
// You can change long to short in the Input Settings
// WARNING:
//  - For purpose educate only
//  - This script to change bars colors.
////////////////////////////////////////////////////////////
PrimeNumberUpBand(price, percent) =>
    res = 0
    res1 = 0
    for j = price to price + (price * percent / 100)
        res1 := j
	    for i = 2 to sqrt(price)
        	res1 := iff(j % i == 0 , 0, j)
            if res1 == 0
                break
		if res1 > 0
		    break
    res := iff(res1 == 0, res[1], res1)
    res

PrimeNumberDnBand(price, percent) =>
    res = 0
    res2 = 0
    for j = price to price - (price * percent / 100)
        res2 := j
	    for i = 2 to sqrt(price)
        	res2 := iff(j % i == 0 , 0, j)
            if res2 == 0
                break
		if res2 > 0
		    break
    res := iff(res2 == 0, res[1], res2)
    res

strategy(title="Prime Number Bands Backtest", overlay = true)
percent = input(5, minval=0.01, step = 0.01, title="Tolerance Percentage")
Length = input(5, minval=1)
srcUp = input(title="Source Up Band",  defval=high)
srcDn = input(title="Source Down Band",  defval=low)
reverse = input(false, title="Trade reverse")
xPNUB = PrimeNumberUpBand(srcUp, percent)
xPNDB = PrimeNumberDnBand(srcDn, percent)
xHighestPNUB = highest(xPNUB, Length)
xLowestPNUB = lowest(xPNDB, Length)
pos = iff(close > xHighestPNUB[1], 1,
       iff(close < xLowestPNUB[1], -1, nz(pos[1], 0)))
possig = iff(reverse and pos == 1, -1,
          iff(reverse and pos == -1, 1, pos))
if (possig == 1)
    strategy.entry("Long", strategy.long)
if (possig == -1)
    strategy.entry("Short", strategy.short)
barcolor(possig == -1 ? red: possig == 1 ? green : blue )
plot(xHighestPNUB, color=red, title="PNUp")
plot(xLowestPNUB, color=green, title="PNDn")
- Moving Average Cross Signal Strategy
- EMA 200 Based Trailing Take Profit and Trailing Stop Loss Strategy
- Up/Down K-Line Pattern High Frequency Arbitrage Strategy
- Dual Moving Average Oscillation Breakout Strategy
- Adaptive Volatility Breakout Strategy
- SuperTrend Strategy for Ethereum Trading
- EMA Crossover and MACD Signals Trend Following Strategy
- Multiple Crossovers Turtle and Weighted Moving Average and MACD and TSI Combination Strategy
- Momentum Strategy Based on DEMA and EMA Crossover with ATR Volatility Filter
- Consecutive Up/Down Strategy with Reverse and SL/TP Extension
- Fast Oscillating RSI Trading Strategy
- Single Exponential Smoothed Moving Average with Trailing Stop Loss Trend Following Strategy
- Buy Low Volatility VS Buy High Volatility Strategy
- Exponential Moving Average Crossover Strategy
- Multi-Timeframe Trailing Stop Loss Strategy
- Momentum Dual Moving Window TSI Indicator
- RSI and Bollinger Bands Profitable Strategy
- Buy/Sell on Candle Close Strategy
- Supertrend Take Profit Strategy
- Price Channel Trend Following Strategy