一、策略概述
本策略命名为动量双滑窗TSI指标策略。该策略的核心思想是利用双EMA滑动窗口平滑价格变动,再结合趋势的方向变化,构建出反映市场买卖力度的动量指标,即TSI指标,并以其作为交易信号来制定买入卖出决策。
二、策略原理
本策略使用双滑动窗口双指数移动平均线来计算价格变动。外层窗口期较长,内层窗口期较短。通过双重平滑去除价格数据中的部分随机性。
首先计算价格的单位变动:
pc = change(price)
然后使用双滑动窗口对价格变动进行双重平滑:
double_smoothed_pc = double_smooth(pc, long, short)
再计算价格变动的绝对值,同样使用双滑动窗口进行双重平滑:
double_smoothed_abs_pc = double_smooth(abs(pc), long, short)
最后,使用平滑后的价格变动除以平滑后的价格变动绝对值,得到反映买卖力度的TSI指标:
tsi_value = 100 * (double_smoothed_pc / double_smoothed_abs_pc)
通过设置不同长度的长短窗口期,可以在一定程度上过滤掉短期市场噪音,使TSI指标更好地反映中长期趋势中的买卖力度。当TSI指标上穿其移动平均线时产生买入信号;当TSI指标下穿其移动平均线时产生卖出信号。
三、策略优势
- 使用双滑动窗口有效过滤掉短期市场噪音,使指标反应更准确
- 计算价格变化也进行了双重平滑,使TSI指标更稳定可靠
- 采用价格变动与价格变动绝对值的比值,自动标准化,更具可比性
- 综合考量了价格变动的方向和力度,作为交易决策的优质指标
- 设置不同参数可以按需调整指标的灵敏度
四、策略风险
- 市场出现长期震荡时,TSI指标可能发出错误信号
- 参数设置不当也会影响指标和信号的质量
- 虽有双滑动窗口,但指标对短期市场噪音还是有一定敏感度
- 长短窗口期差距太大时,指标和信号可能出现滞后
可以通过调整窗口期参数,适当缩短信号平均线长度来优化;当市场震荡,可暂时停止交易以控制风险。
五、优化方向
- 测试不同的长短窗口期参数组合,寻找最优参数
- 尝试其他类型的滑动平均线,如线性加权移动平均线
- 增加指标的平滑度,构建三重或多重滑动窗口
- 结合其他辅助指标,优化买卖点选择
- 设定止损策略,严格控制单笔损失
六、总结
本策略基于价格变动的双重平滑计算出反映买卖力度的TSI动量指标,双滑窗过滤噪音,price change的变化也作双平滑,指标更稳定可靠;采用标准化比率,具有可比性;指标综合价格变化的方向和力度,作为高质量信号;通过参数调整可以自由控制指标灵敏度。在参数优化和风险控制到位的情况下,是非常实用的量化交易策略选择。
/*backtest
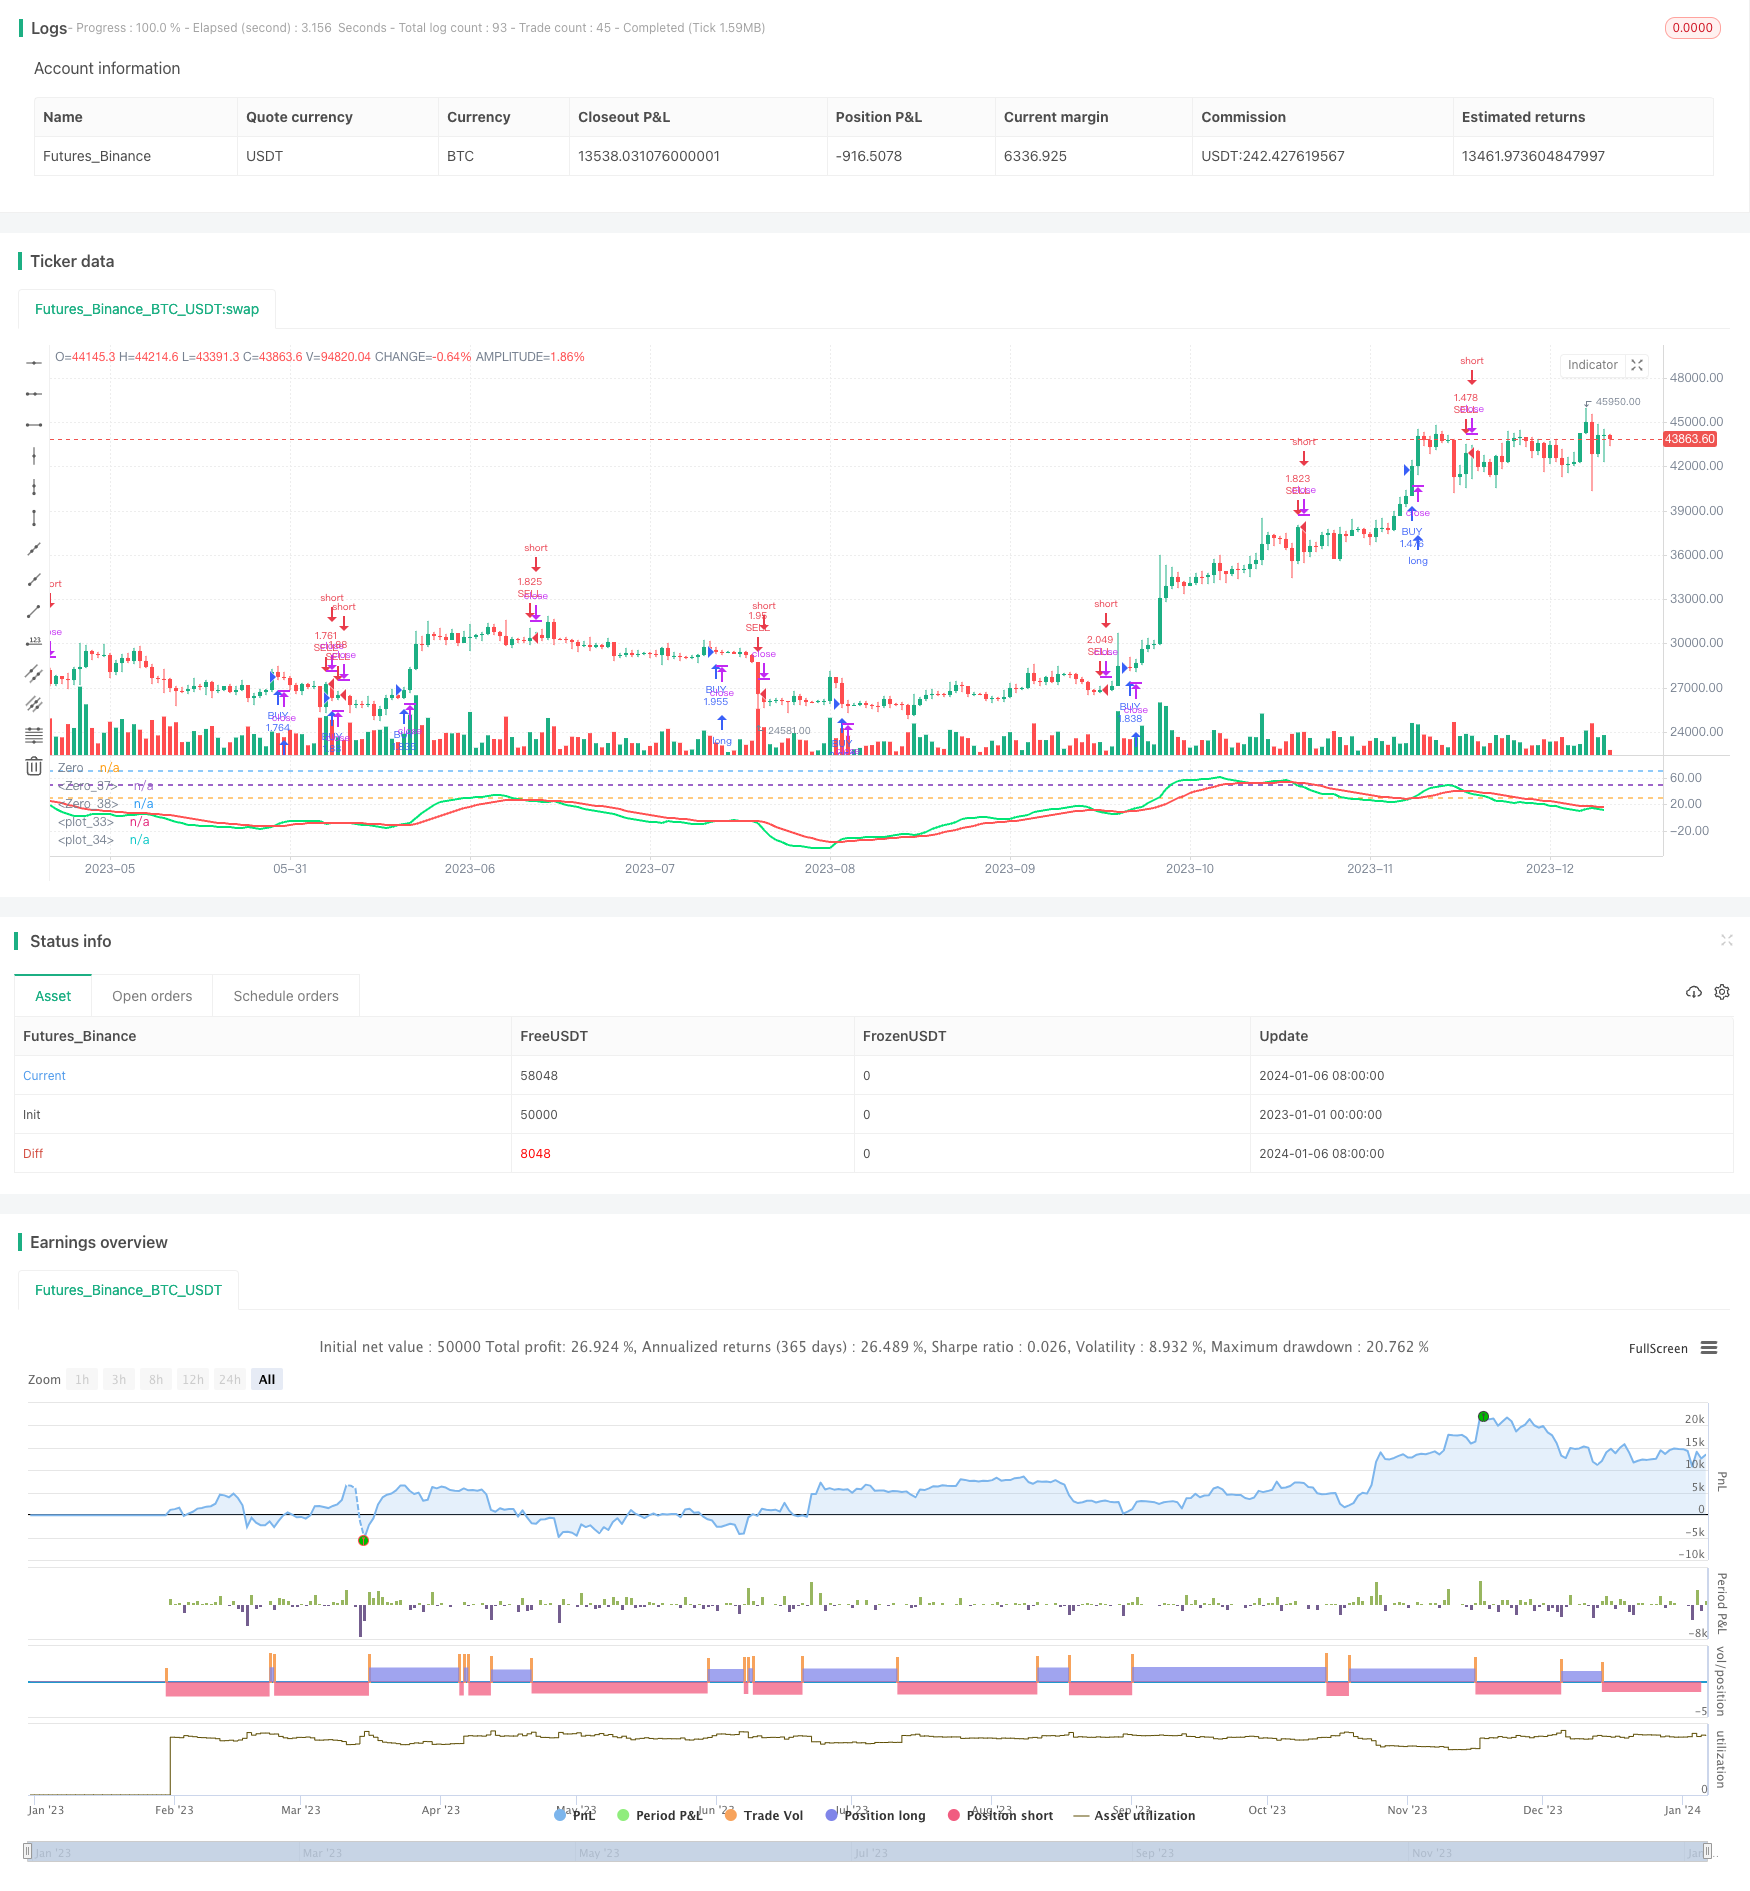
start: 2023-01-01 00:00:00
end: 2024-01-07 00:00:00
period: 1d
basePeriod: 1h
exchanges: [{"eid":"Futures_Binance","currency":"BTC_USDT"}]
*/
//@version=2
strategy("True Strength Indicator BTCUSD 2H", shorttitle="TSI BTCUSD 2H",initial_capital=1000, commission_value=0.2, commission_type =strategy.commission.percent, default_qty_value=100 , overlay = false, pyramiding=10, default_qty_type=strategy.percent_of_equity)
//BASED ON True Strength Indicator MTF
resCustom = input(title="Timeframe", defval="120" )
long = input(title="Long Length", defval=25)
short = input(title="Short Length", defval=13)
signal = input(title="Signal Length", defval=13)
length = input(title="Период", defval=300)
FromMonth = input(defval = 1, title = "From Month", minval = 1, maxval = 12)
FromDay = input(defval = 1, title = "From Day", minval = 1, maxval = 31)
FromYear = input(defval = 2017, title = "From Year", minval = 2017)
ToMonth = input(defval = 1, title = "To Month", minval = 1, maxval = 12)
ToDay = input(defval = 1, title = "To Day", minval = 1, maxval = 31)
ToYear = input(defval = 9999, title = "To Year", minval = 2017)
start = timestamp(FromYear, FromMonth, FromDay, 00, 00) // backtest start window
finish = timestamp(ToYear, ToMonth, ToDay, 23, 59) // backtest finish window
window() => true // create function "within window of time"
price = request.security(syminfo.tickerid,resCustom,close)
double_smooth(src, long, short) =>
fist_smooth = ema(src, long)
ema(fist_smooth, short)
pc = change(price)
double_smoothed_pc = double_smooth(pc, long, short)
double_smoothed_abs_pc = double_smooth(abs(pc), long, short)
tsi_value = 100 * (double_smoothed_pc / double_smoothed_abs_pc)
tsi2=ema(tsi_value, signal)
plot(tsi_value, color=lime,linewidth=2)
plot(tsi2, color=red,linewidth=2)
hline(30, title="Zero")
hline(50, title="Zero",linewidth=2)
hline(70, title="Zero")
buy = crossover(tsi_value, tsi2)
sell = crossunder(tsi_value, tsi2)
if(buy)
strategy.entry("BUY", strategy.long, when = window())
if(sell)
strategy.entry("SELL", strategy.short, when = window())
//greentsi =tsi_value
//redtsi = tsi2
//bgcolor( greentsi>redtsi and rsiserie > 50 ? lime : na, transp=90)
//bgcolor( greentsi<redtsi and rsiserie < 50 ? red : na, transp=90)
//yellow1= redtsi > greentsi and rsiserie > 50
//yellow2 = redtsi < greentsi and rsiserie < 50
//bgcolor( yellow1 ? yellow : na, transp=80)
//bgcolor( yellow2 ? yellow : na, transp=50)
//bgcolor( yellow1 and yellow1[1] ? yellow : na, transp=70)
//bgcolor( yellow2 and yellow2[2] ? yellow : na, transp=70)
//bgcolor( rsiserie > 70 ? lime : na, transp=60)
//bgcolor( rsiserie < 30 ? red : na, transp=60)