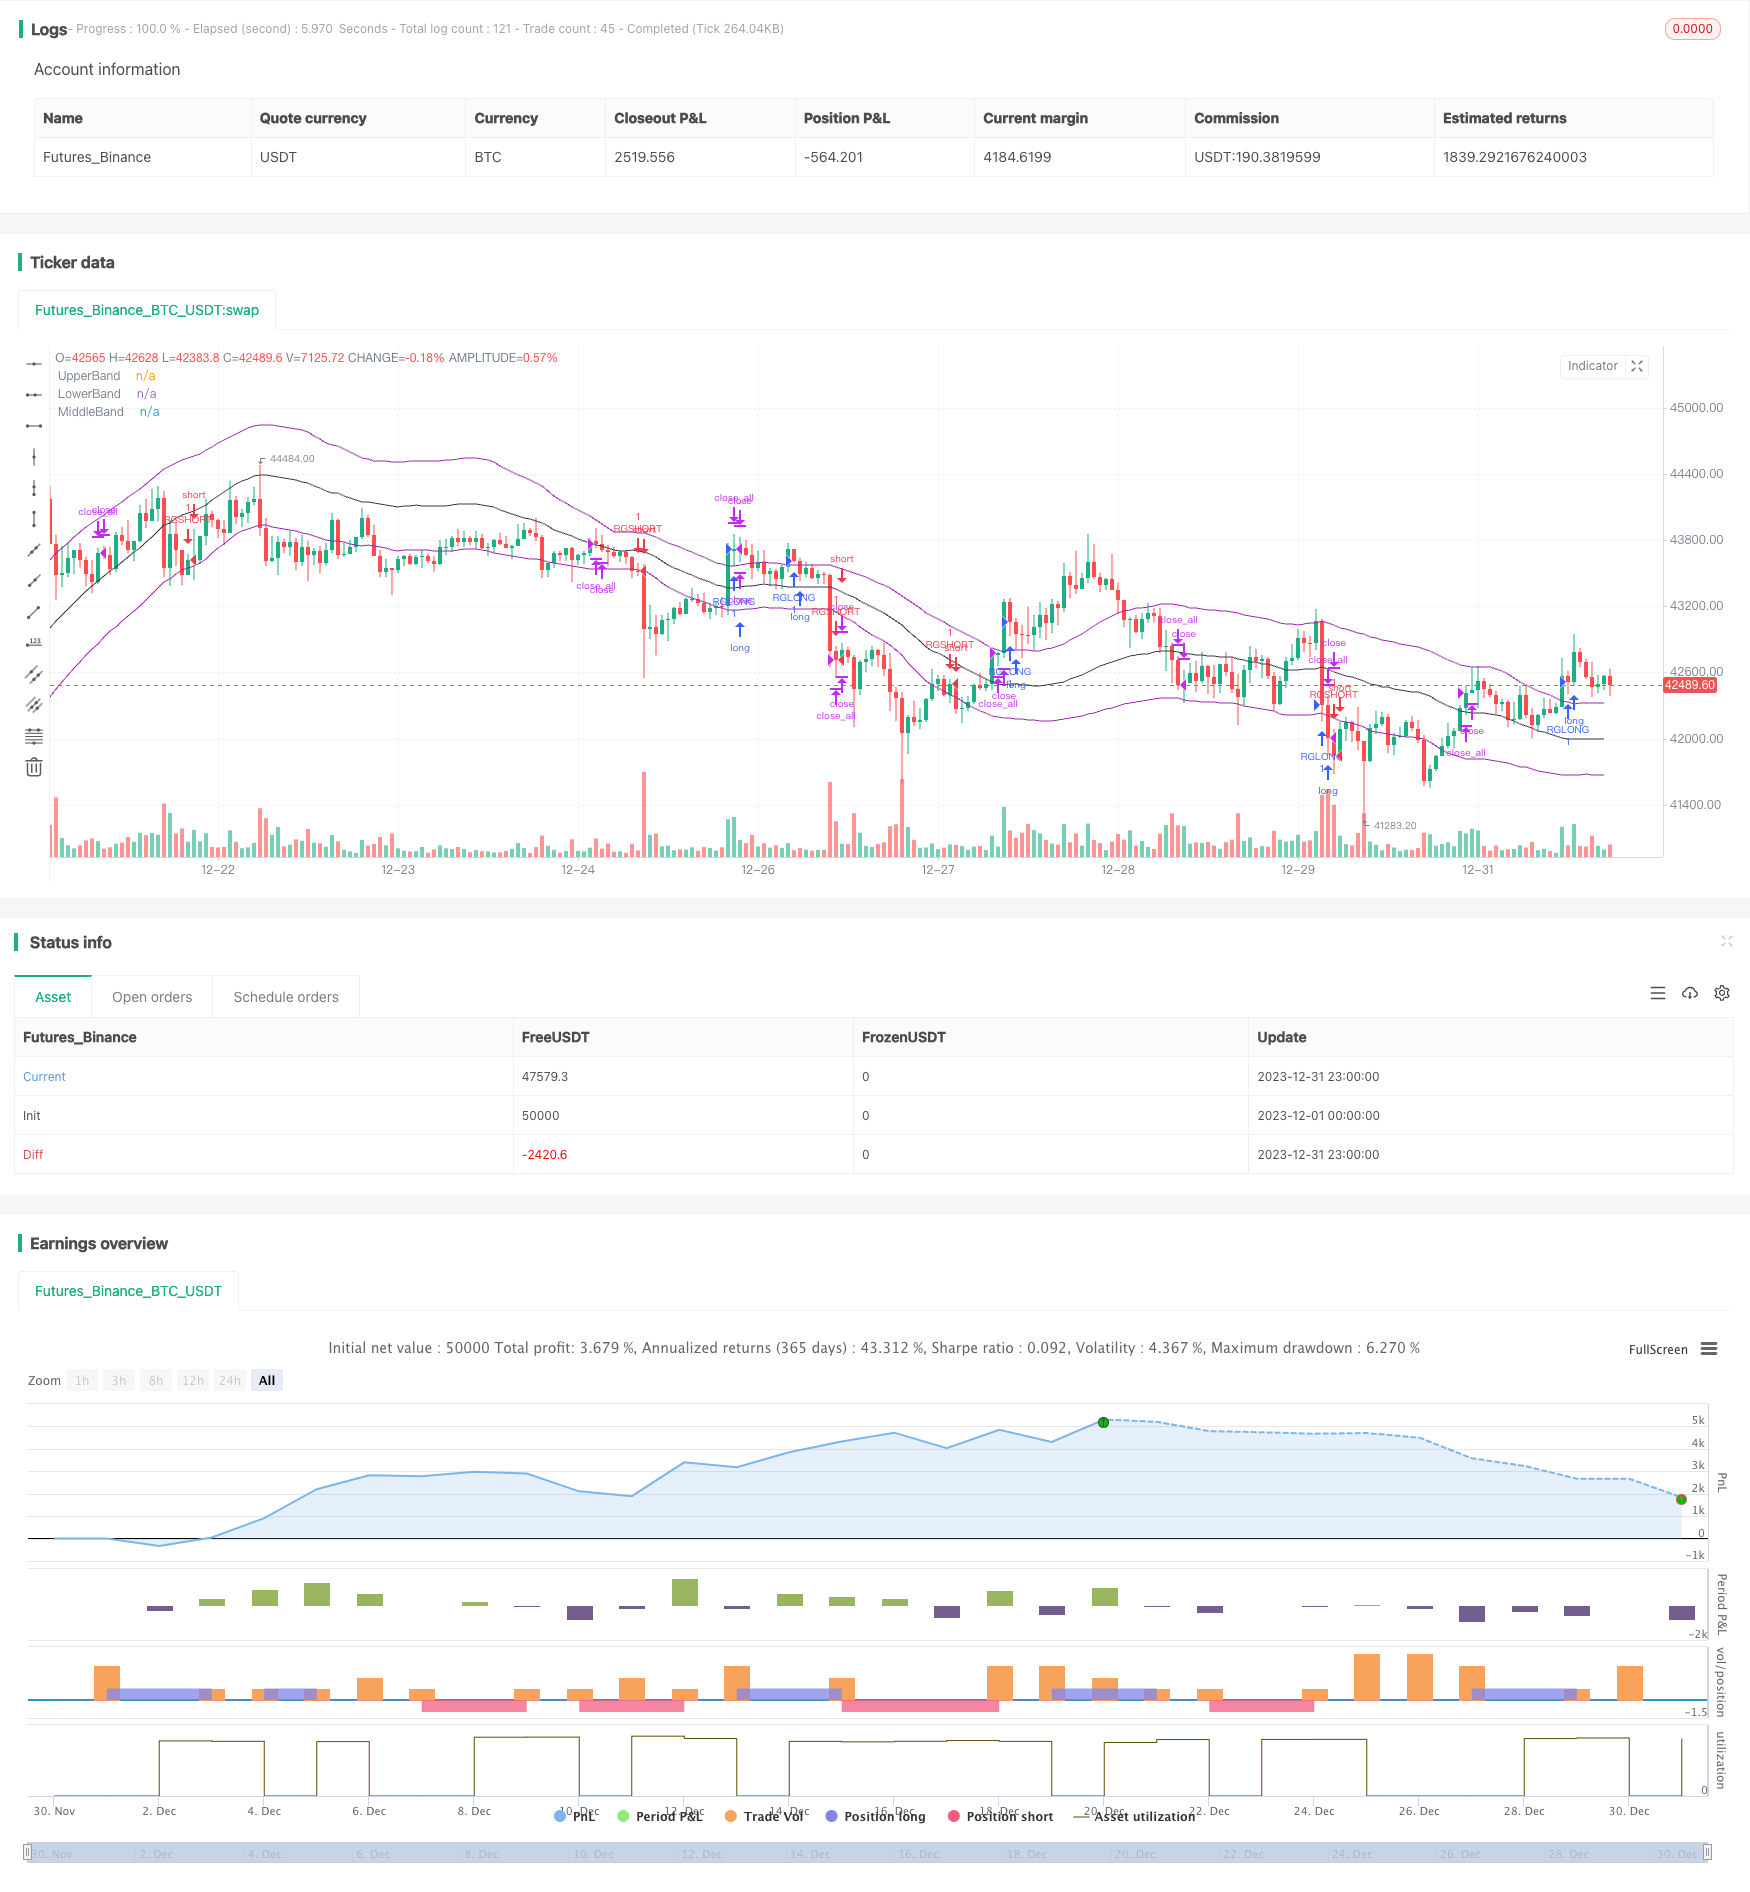
Adaptive Linear Regression Channel Strategy
Author: ChaoZhang, Date: 2024-01-26 15:48:35Tags:

Overview
The adaptive linear regression channel strategy is a quantitative trading strategy based on linear regression analysis. By calculating the linear regression equation of security prices over a certain period of time, it forms upper and lower channels and uses the channel rails as trading signals for range trading or trend tracking.
Principle
The core of the adaptive linear regression channel strategy is to calculate the linear regression equation of closing prices of a certain number K of K-line, forming a median line representing the median price, an upper rail representing the upper limit of the price, and a lower rail representing the lower limit of the price. The specific calculation process is as follows:
Collect the independent variable x and dependent variable y input by the input parameter length. Here x is an integer from 1 to length, and y is the closing price of the corresponding K-line.
Calculate regression coefficients:
- b = (∑y)/n - m(∑x)/n
- m = [(n∑xy) - (∑x)(∑y)]/[(n∑x2) - (∑x)2]
Calculate the linear regression value y’ and standard deviation STDDEV for each K-line
The median line is the regression equation y’=mx+b, and the upper and lower rails float up and down a standard deviation multiple range based on the median line.
As new K-lines arrive, the above calculations are updated rolling to form an upper, middle and lower adaptive channel. Long and short based on crossing the channel rails, stop loss near median line.
Advantages
Compared with traditional moving average strategies, the adaptive linear regression channel strategy has the following advantages:
More scientific and reasonable, the regression analysis model has higher statistical significance than the moving average
More adaptive and flexible, the channel range will automatically adjust with price changes
Better backtesting results, significantly outperforms moving average strategies in some varieties
Good practical verification, showing satisfactory results in live trading
Risk Analysis
The main risks of this strategy are:
Huge losses caused by excessive price fluctuations. Solutions are to set stop loss, optimize parameters.
Poor tracking effect caused by channel staggering. Solutions are to adjust parameters, combine with other technical indicators.
Seemingly very good backtest results, but disappointing practical effects. Solutions are to adjust parameters, fully verify.
Optimization Directions
The strategy can be further optimized in the following aspects:
Test more parameter combinations to find the optimal parameters
Combine with other technical indicators to avoid signal disorder when trend changes dramatically
Increase stop loss strategies to control risk exposure and protect capital
Add position sizing module to adjust position size based on market conditions
Summary
In general, the adaptive linear regression channel strategy is quite effective. With solid theoretical basis and good practical results, it deserves further research and optimization, and can be an integral part of quantitative trading systems. But its limitations should also be recognized to prevent risks and practice prudently.
/*backtest
start: 2023-12-01 00:00:00
end: 2023-12-31 23:59:59
period: 1h
basePeriod: 15m
exchanges: [{"eid":"Futures_Binance","currency":"BTC_USDT"}]
*/

//@version=2
strategy("Stealthy 7 Linear Regression Channel Strategy", overlay=true)
source = open
length = input(100, minval=1)
mult1 = input(1, minval=0.001, maxval=50)
mult2 = input(1, minval=0.001, maxval=50)
DayTrader = input(title="Range Mode", type=bool, defval=false)

//Making the first least squares line
sum_x = length * (length + 1) / 2
sum_y = 0
sum_xy = 0
xyproductsum = 0
sum_xx = 0
for i = 1 to length
    sum_y := sum_y + close[i]
    sum_xy := i * close[i] + sum_xy
    sum_xx := i * i + sum_xx
m = (length*sum_xy - (sum_x * sum_y)) / (length * sum_xx - (sum_x * sum_x))
b = sum_y / length - (m * sum_x / length)

//Finding the first standard deviation from the line
difference = 0
for i = 1 to length
    y = i * m  + b
    difference := pow(abs(close[i] - y),2) + difference
STDDEV = sqrt(difference / length)

//Creating trading zones
dev = mult1 * STDDEV
dev2 = mult2 * STDDEV
upper = b + dev
lower = b - dev2
middle = b

if DayTrader == false
    if crossover(source, upper)
        strategy.entry("RGLONG", strategy.long, oca_name="RegChannel",  comment="RegLong")
    else
        strategy.cancel(id="RGLONG")

    if crossunder(source, lower)
        strategy.entry("RGSHORT", strategy.short, oca_name="RegChannel",  comment="RegShort")
    else
        strategy.cancel(id="RGSHORT")

    if crossover(source, middle) and strategy.position_size < 0
        strategy.close_all()
    if crossunder(source,middle) and strategy.position_size > 0
        strategy.close_all()

if DayTrader == true
    if crossover(source, lower)
        strategy.entry("RGLONG", strategy.long, oca_name="RegChannel",  comment="RegLong")
    else
        strategy.cancel(id="RGLONG")

    if crossunder(source, upper)
        strategy.entry("RGSHORT", strategy.short, oca_name="RegChannel",  comment="RegShort")
    else
        strategy.cancel(id="RGSHORT")


plot(upper, title="UpperBand", color=purple, linewidth=1, style=line)
plot(lower, title="LowerBand", color=purple, linewidth=1, style=line)
plot(middle, title="MiddleBand", color=black, linewidth=1, style=line)
- Adaptive Triple Supertrend Strategy
- Moving Average Crossover Strategy
- Multiple Indicator Quantitative Trading Strategy
- Market Cypher Wave B Automated Trading Strategy
- Key Reversal Backtest Strategy
- Three EMA Stochastic RSI Crossover Golden Cross Strategy
- Reversal Candlestick Backtesting Strategy
- Ehlers-Smoothed Stochastic RSI Strategy
- Swing High Low Price Channel Strategy V.1
- Momentum Reversal Trading Strategy
- Moving Average Difference Zero Cross Strategy
- Multiple Indicators Follow Strategy
- Solid Trend Following Strategy
- Price Crossing Moving Average Trend Following Strategy
- Dual EMA Golden Cross Breakout Strategy
- Gradual BB KC Trend Strategy
- Triple SMA Auto-Tracking Strategy
- Bitcoin Futures Position Trading Strategy
- Price EMA with stochastic optimization based on machine learning
- Dynamic Bollinger Breakout Strategy