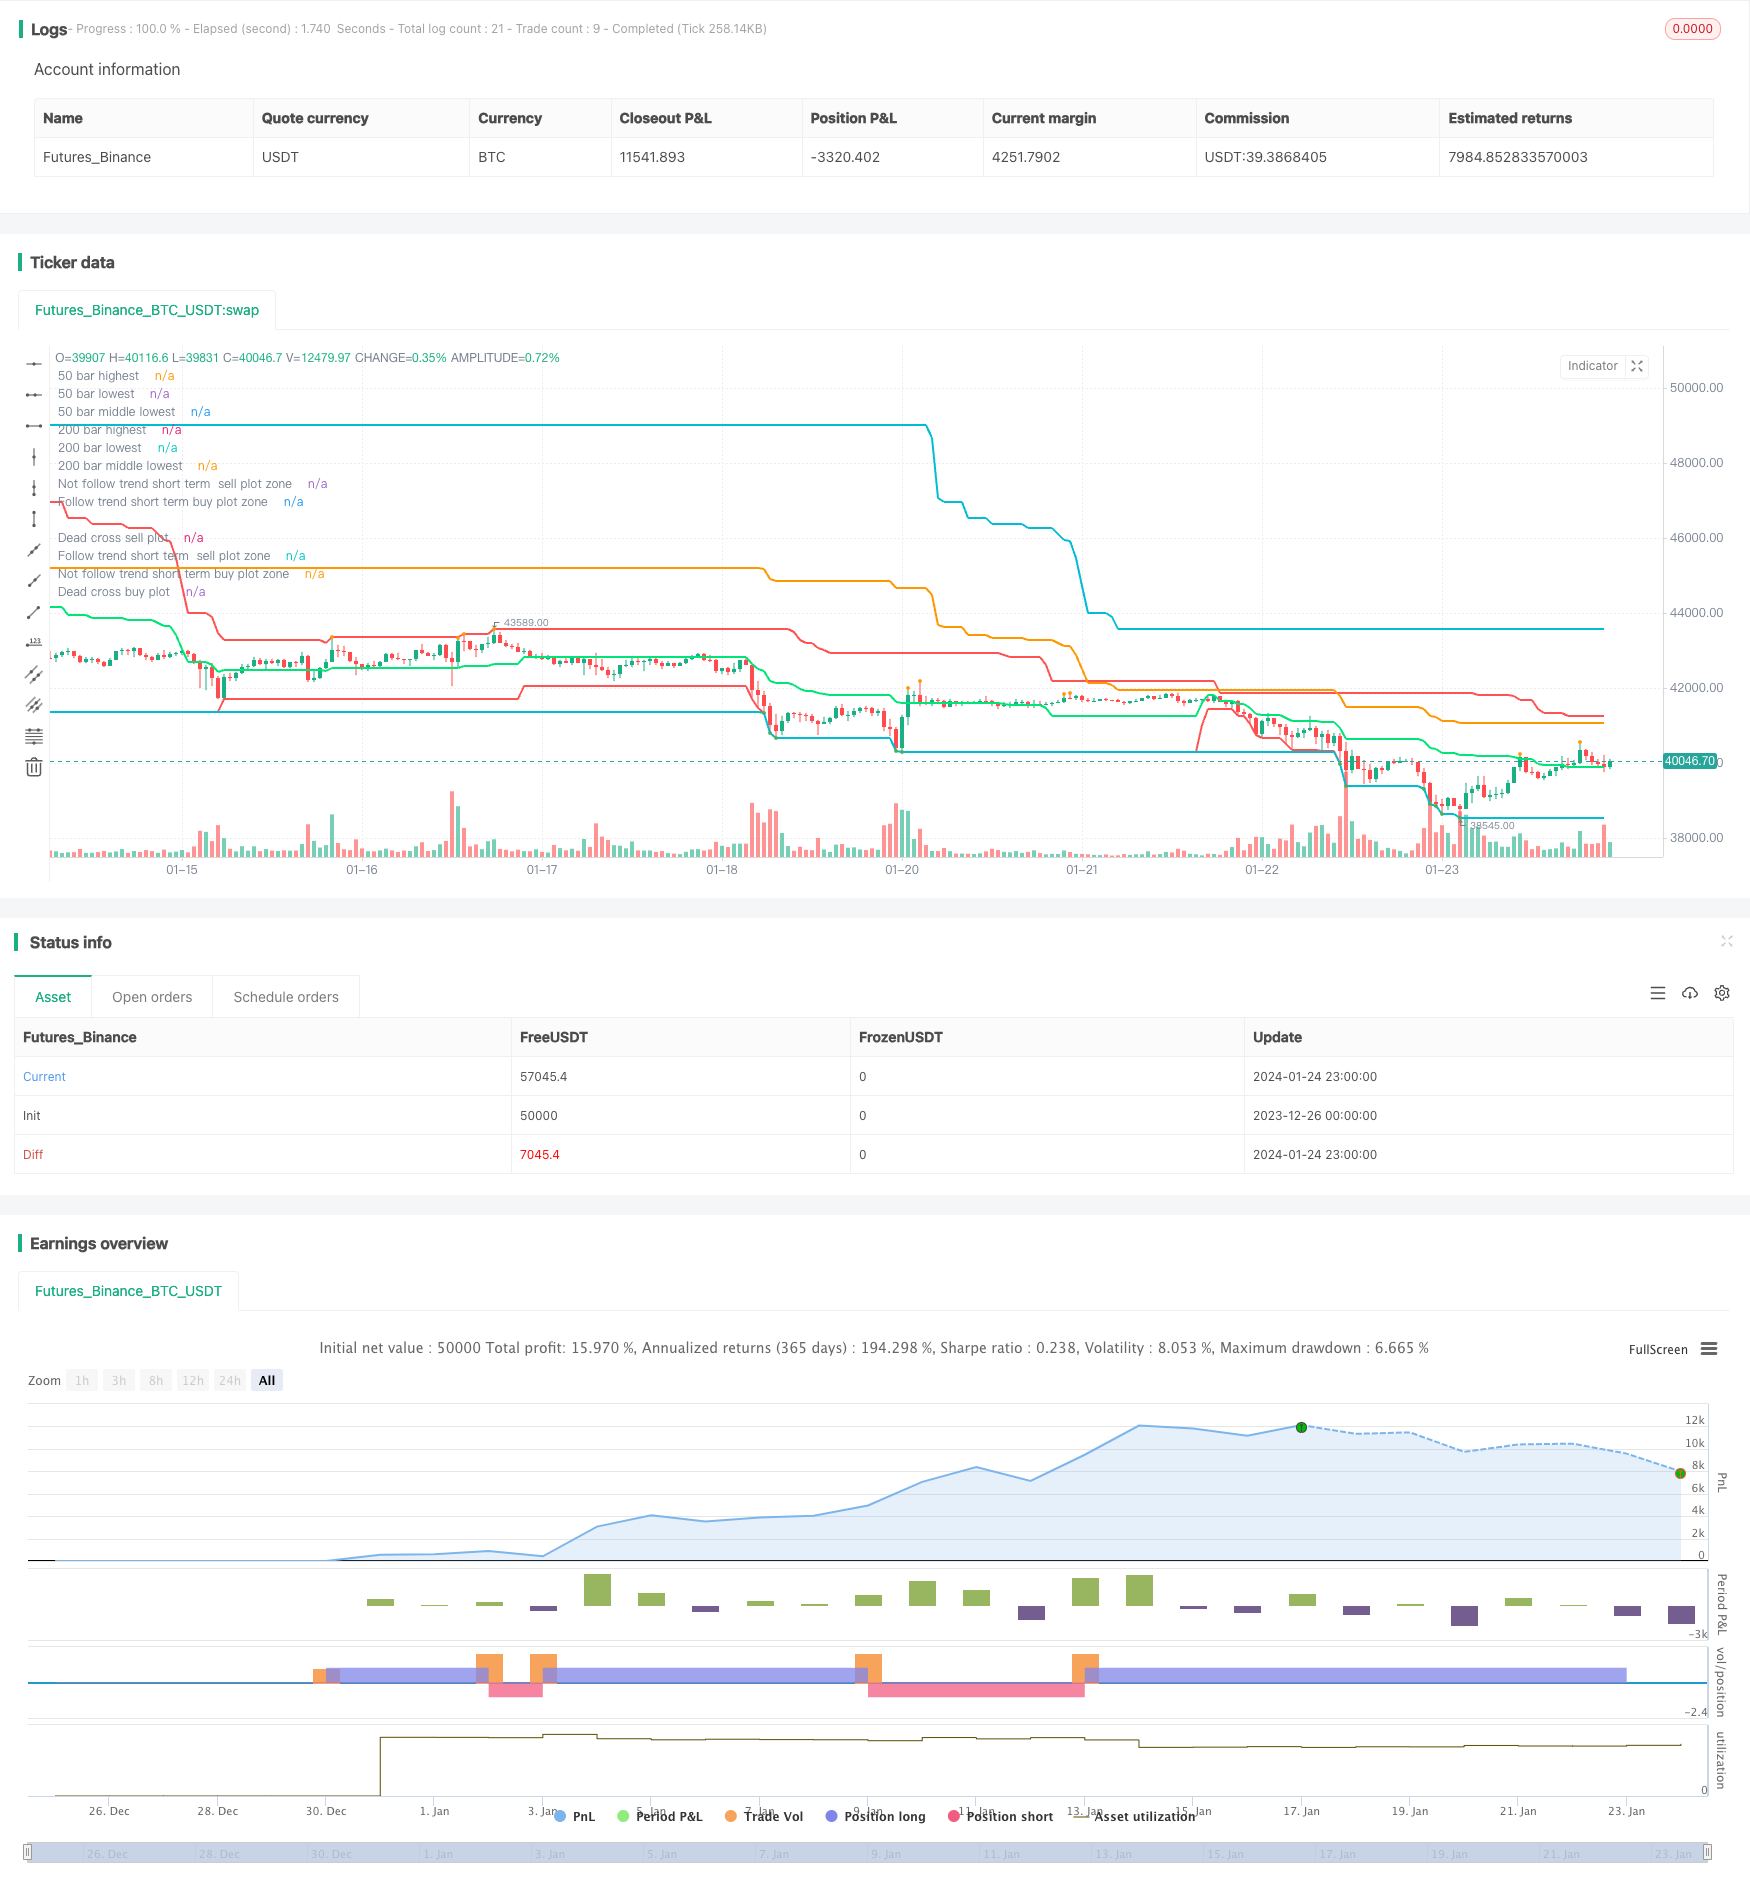
Swing High Low Price Channel Strategy V.1
Author: ChaoZhang, Date: 2024-01-26 15:54:45Tags:

Overview
This strategy calculates the highest and lowest prices within different timeframes (50 bars and 200 bars) to form the main price channel representing the long-term trend. It also uses fast and slow signal lines to determine the short-term trend direction. The strategy will prompt entry signals when the long-term and short-term trend directions are consistent.
Principle
Firstly, by calculating the highest and lowest prices of the last 50 bars and the last 200 bars, two price channels are formed to represent the long-term trend direction.
Secondly, the highest and lowest prices of the last 7 bars are calculated to form a fast signal channel to judge the short-term trend; The highest and lowest prices of the last 20 bars are calculated to form a slow signal channel to judge the shorter-term trend.
Finally, entry signals are prompted when the directions of the fast signal channel, slow signal channel and long-term price channel are consistent. For example, when all channels are in an upward trend, it will prompt to buy; when all channels are in a downward trend, it will prompt to sell.
Advantage Analysis
The biggest advantage of this strategy is that it can identify a unified trend direction in both long and short terms. By confirming the price channels of different time frames, it can effectively avoid being misled by short-term market noise.
In addition, the multi-timeframe judgement ensures signal stability even if short-term price reversal occurs.
Risk Analysis
The main risk of this strategy is that when long and short term trend reversal occurs, there will be a certain lag in signal generation due to the need for confirmation of multiple time frame channels. Blindly following at this time may lead to greater losses.
In addition, it is unfriendly to high frequency trading and unable to respond quickly to short-term price fluctuations. In case of violent market conditions, improper stop loss settings can also lead to large losses.
Optimization
Consider joining an adaptive dynamic stop loss strategy that stops loss when the price breaks through a certain percentage in an unfavorable direction to effectively control risks.
Also, more price channels of different lengths could be added and the final signal could be decided by voting to improve accuracy.
Alternatively, machine learning algorithms could be used to automatically optimize various channel parameters to better suit the current market environment.
Summary
The overall idea of this strategy is clear and easy to understand. By judging market trends through multi-timeframe price channels, it can effectively filter out short-term market noise. However, its handling of reversal trends and risk control need improvement. By combining stop loss strategies and parameter optimization, strategy stability and practical effects can be further enhanced.
/*backtest
start: 2023-12-26 00:00:00
end: 2024-01-25 00:00:00
period: 1h
basePeriod: 15m
exchanges: [{"eid":"Futures_Binance","currency":"BTC_USDT"}]
*/

// This source code is subject to the terms of the Mozilla Public License 2.0 at https://mozilla.org/MPL/2.0/
// © ZoomerXeus

//@version=4
strategy("Swing High Low Price Channel V.1", overlay=true)

//========================= variable =================================//
dead_channel_source = input(title="Main swing channel source", defval="H/L", options=["H/L"])
fast_signal_length = input(title="Fast Slow Length", type=input.integer, defval=7, maxval=49, minval=1)
slow_signal_length = input(title="Slow Slow Length", type=input.integer, defval=20, maxval=49, minval=1)
is_show_only_dead_channel = input(title="Show main channel only", defval=true)
main_channel_width = input(title="Main line width", defval=2, minval=1)
signal_channel_width = input(title="Signal line width", defval=1, minval=1)

//========================= indicator function =================================//
dead_cross_high_50 = highest(high, 50)
dead_cross_high_200 = highest(high, 200)
//========================================
dead_cross_low_50 = lowest(low, 50)
dead_cross_low_200 = lowest(low, 200)
//========================================
medain_dead_cross_50 = ((dead_cross_high_50-dead_cross_low_50)*0.5)+dead_cross_low_50
medain_dead_cross_200 = ((dead_cross_high_200-dead_cross_low_200)*0.5)+dead_cross_low_200


//========================================
fasthighest = highest(high, fast_signal_length)
fastlowest = lowest(low, fast_signal_length)
//========================================
slowhighest = highest(high, slow_signal_length)
slowlowest = lowest(low, slow_signal_length)
//========================================


//========================= plot =================================//
plot(dead_channel_source == "H/L" ? dead_cross_high_50 : na,title="50 bar highest", color=color.red, linewidth=main_channel_width)
plot(dead_channel_source == "H/L" ? dead_cross_high_200 : na,title="200 bar highest", color=color.aqua, linewidth=main_channel_width)
plot(dead_channel_source == "H/L" ? dead_cross_low_50 : na,title="50 bar lowest", color=color.red, linewidth=main_channel_width)
plot(dead_channel_source == "H/L" ? dead_cross_low_200 : na,title="200 bar lowest", color=color.aqua, linewidth=main_channel_width)
plot(dead_channel_source == "H/L" ? medain_dead_cross_200 : na,title="200 bar middle lowest", color=color.orange, linewidth=main_channel_width)
plot(dead_channel_source == "H/L" ? medain_dead_cross_50 : na,title="50 bar middle lowest", color=color.lime, linewidth=main_channel_width)
//===========================================
plot(is_show_only_dead_channel == false ? fasthighest : na,title="fast signal highest", color=#ff00f9, linewidth=signal_channel_width)
plot(is_show_only_dead_channel == false ? fastlowest : na,title="fast signal lowest", color=#ff00f9, linewidth=signal_channel_width)
plot(is_show_only_dead_channel == false ? slowhighest : na,title="slow signal highest", color=color.white, linewidth=signal_channel_width)
plot(is_show_only_dead_channel == false ? slowlowest : na,title="slow signal lowest", color=color.white, linewidth=signal_channel_width)
//===========================================
plot(crossover(medain_dead_cross_50, medain_dead_cross_200) ? medain_dead_cross_200 : na, title="Dead cross buy plot", style=plot.style_circles, linewidth=6, color=color.lime)
plot(crossunder(medain_dead_cross_50, medain_dead_cross_200) ? medain_dead_cross_200 : na, title="Dead cross sell plot", style=plot.style_circles, linewidth=6, color=color.red)
plot(is_show_only_dead_channel and (medain_dead_cross_50 < medain_dead_cross_200) and high == slowhighest ? high : na, title="Follow trend short term  sell plot zone", style=plot.style_circles, linewidth=3, color=color.orange)
plot(is_show_only_dead_channel and (medain_dead_cross_50 > medain_dead_cross_200) and low == slowlowest ? low : na, title="Follow trend short term buy plot zone", style=plot.style_circles, linewidth=3, color=color.green)
plot(is_show_only_dead_channel and high == slowhighest and (high == dead_cross_high_200) ? high : na, title="Not follow trend short term  sell plot zone", style=plot.style_circles, linewidth=3, color=color.orange)
plot(is_show_only_dead_channel and low == slowlowest and (low == dead_cross_low_200) ? low : na, title="Not follow trend short term buy plot zone", style=plot.style_circles, linewidth=3, color=color.green)

//===================== open close order condition =========================================================//
strategy.entry("strong buy", true, 1, when=low == dead_cross_low_200)
strategy.exit("close strong buy 50%", "strong buy", qty_percent=50, when=high==slowhighest)
strategy.entry("strong sell", false, 1, when=high == dead_cross_high_200)
strategy.exit("close strong sell 50%", "strong sell", qty_percent=50, when=low==slowlowest)
- Wave Trend and VWMA Based Trend Following Quant Strategy
- Dual Moving Average and Williams Average Combination Strategy
- Adaptive Triple Supertrend Strategy
- Moving Average Crossover Strategy
- Multiple Indicator Quantitative Trading Strategy
- Market Cypher Wave B Automated Trading Strategy
- Key Reversal Backtest Strategy
- Three EMA Stochastic RSI Crossover Golden Cross Strategy
- Reversal Candlestick Backtesting Strategy
- Ehlers-Smoothed Stochastic RSI Strategy
- Momentum Reversal Trading Strategy
- Adaptive Linear Regression Channel Strategy
- Moving Average Difference Zero Cross Strategy
- Multiple Indicators Follow Strategy
- Solid Trend Following Strategy
- Price Crossing Moving Average Trend Following Strategy
- Dual EMA Golden Cross Breakout Strategy
- Gradual BB KC Trend Strategy
- Triple SMA Auto-Tracking Strategy
- Bitcoin Futures Position Trading Strategy