Gold Cross Dead Cross Quantitative Trading Strategy
Author: ChaoZhang, Date: 2024-02-02 14:46:11Tags:

Overview
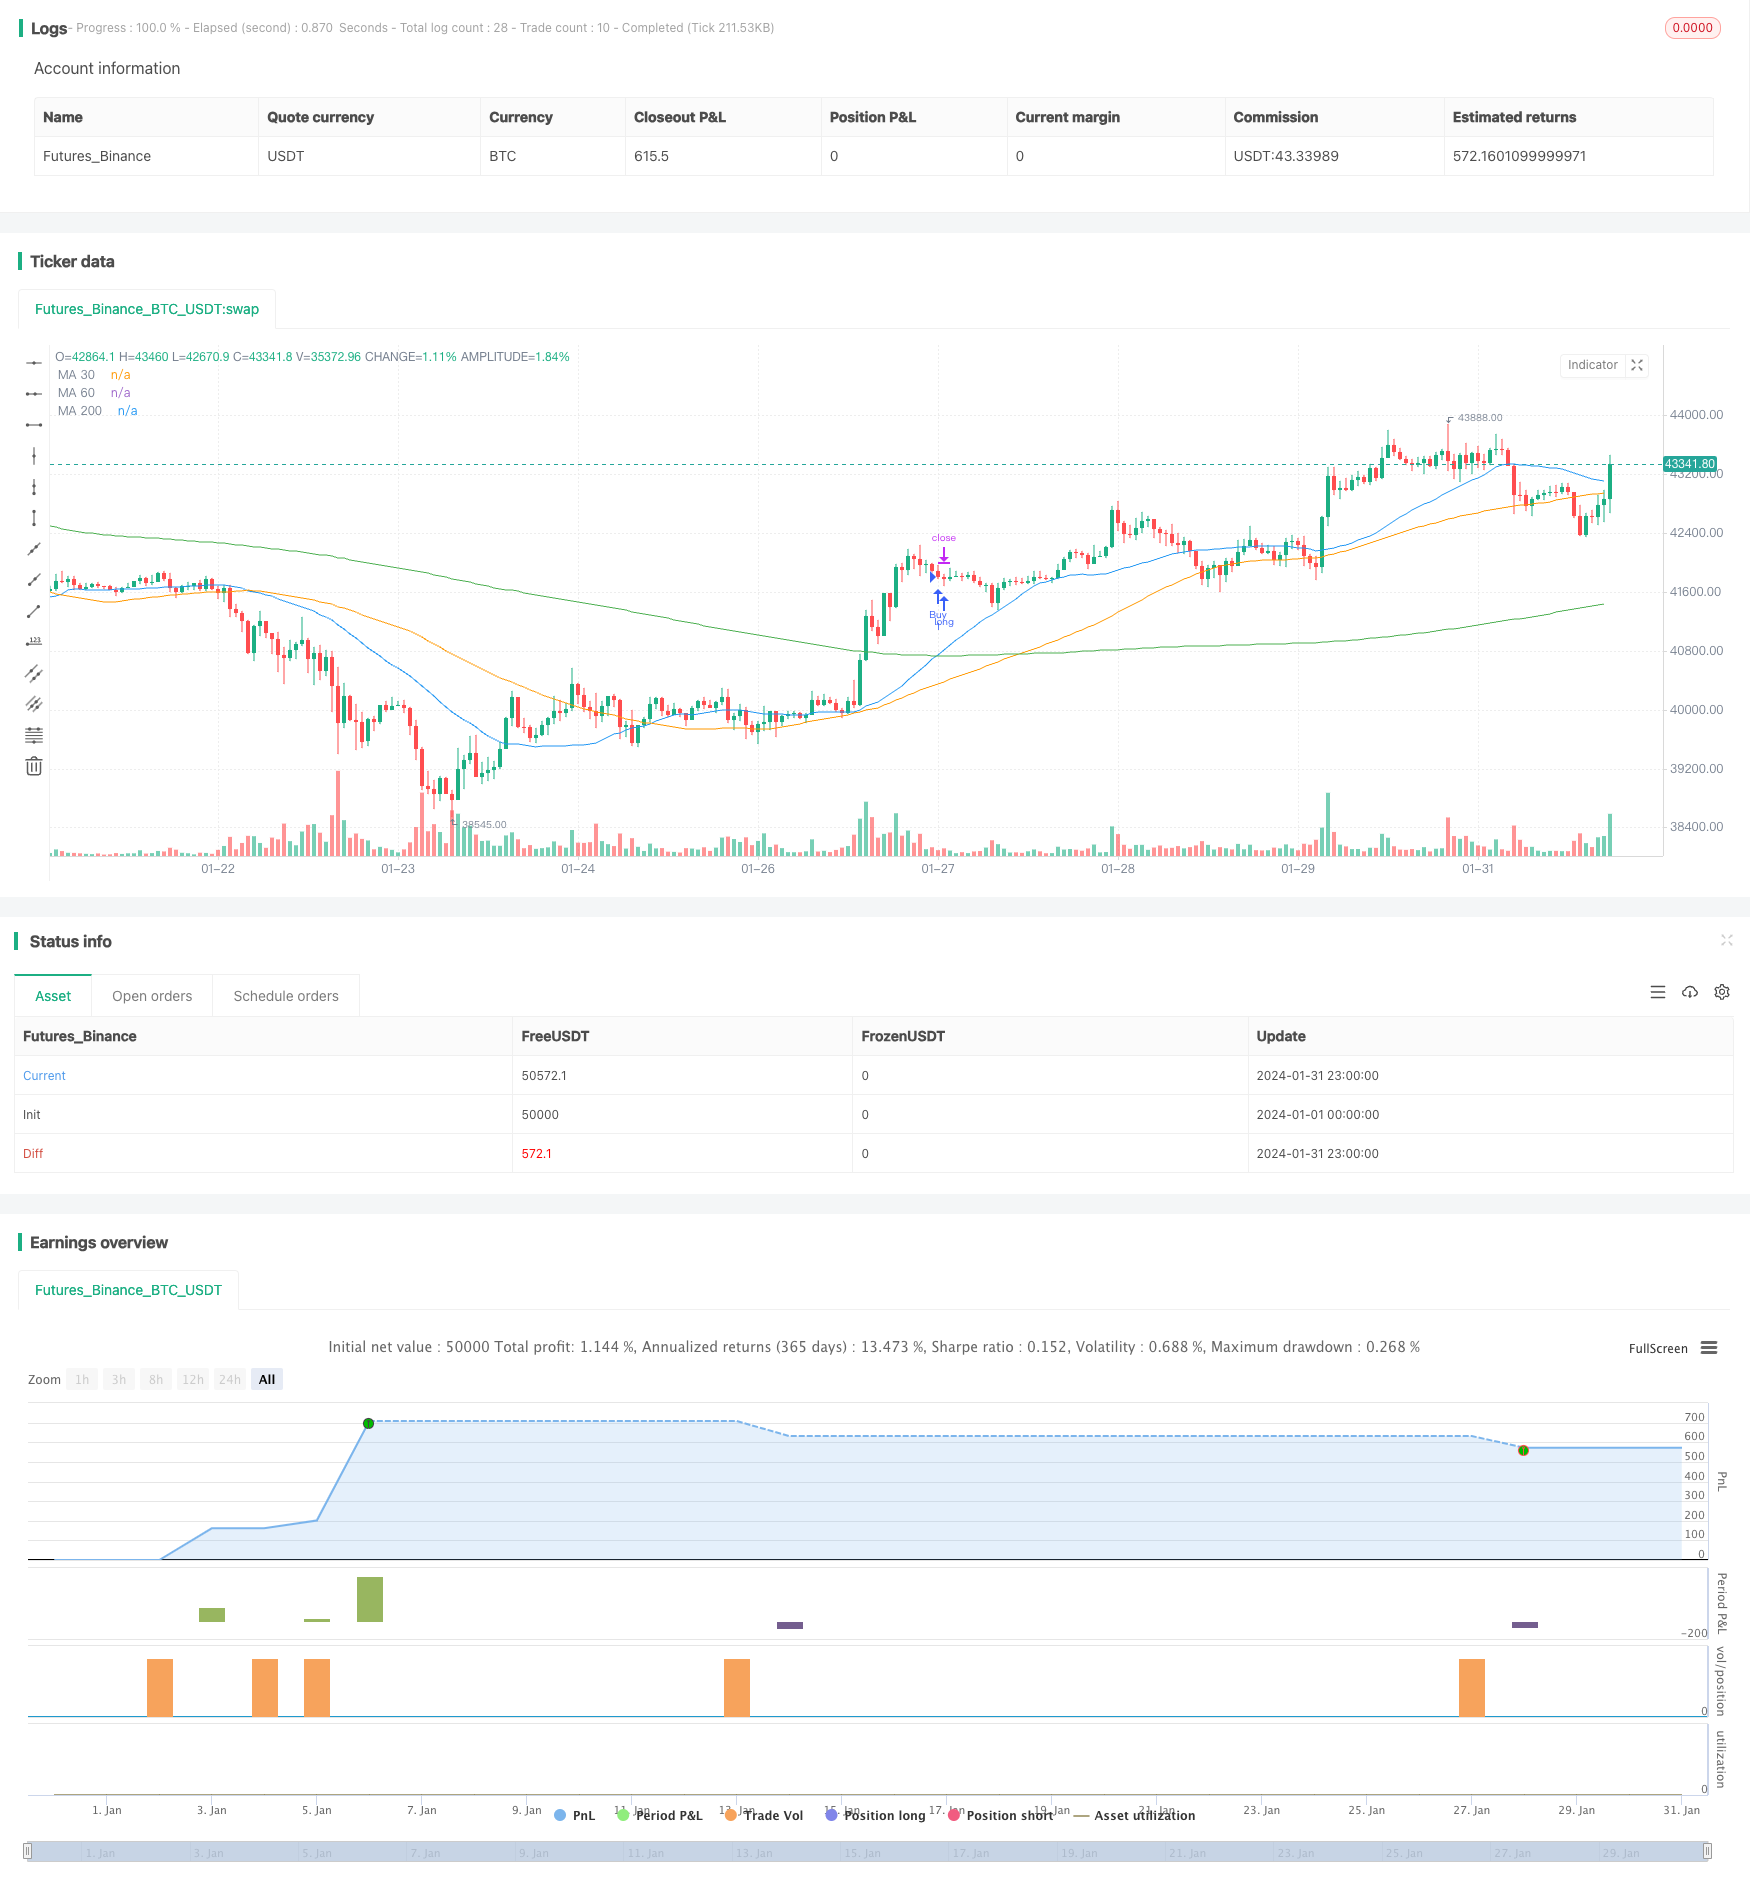
This strategy calculates the 30-day simple moving average (MA30) and 200-day simple moving average (MA200) crossovers of XAUUSD (gold) to implement gold cross buys and dead cross sells quantitative trading. The strategy also sets stop loss and take profit prices for automatic position closing.
Strategy Principle
The core indicators of this strategy are MA30 and MA200. When MA30 crosses above MA200, a buy signal is generated. When MA30 crosses below MA200, a sell signal is generated. These crosses are called “gold crosses” and “dead crosses”.
Specifically, the strategy uses the ta library to calculate MA30 and MA200. The ta.crossover and ta.crossunder functions then judge if they cross. When an upward crossover (gold cross) occurs, the longCondition value is set to true for buying. When a downward crossover (dead cross) occurs, the shortCondition value is set to true for selling.
For order execution, stop loss and take profit prices of 40,000 points each are set for long and short trades. This corresponds to a 4,000 point price change in XAUUSD. When the price triggers the stop loss or take profit, orders will close positions automatically.
In addition, a hedging mechanism is established in the strategy. If the current position is long, a subsequent dead cross signal will directly flatten the position and reverse it. If the current position is short, a subsequent gold cross signal will also directly flatten and reverse the position. This avoids large losses during trend reversions.
Advantages
This is a very simple and intuitive trend following strategy. It has the following advantages:
- Clear rules that are easy to implement.
- Applicable to multiple time frames for day and long term trading.
- Aligns with market cycles and captures trend reversions.
- Sets auto exit mechanism with stop loss/profit to control single trade loss.
- Establishes hedging to avoid losses from trend reversions.
Risk Analysis
There are some risks to this strategy:
- MA indicators lag and may miss best entry for short term trend reversals.
- Improper stop loss setting may prematurely exit trades.
- Too many reverse signals increase unnecessary trading.
- The strategy has capital requirements to withstand drawdowns.
These risks can be managed by parameter optimization, adjusting stop loss levels, filtering reverse signals etc.
Optimization
The strategy can be optimized in several ways:
- Optimize MA parameters using EMA or weighted moving averages.
- Add other filters like volume, volatility indicators etc.
- Enable hedging mechanism only on significant signals.
- Set up position sizing for better capital efficiency.
- Dynamically optimize stops/profits using machine learning algorithms.
Parameter tuning, adding filters, position sizing etc. can further improve strategy stability.
Conclusion
This is a simple and practical moving average crossover strategy. It aligns with market cycles, controls risk through automated stop loss/profit exits and hedging mechanisms. Easy to understand and implement, it is applicable for multiple products and time frames. Further optimizations can improve risk/reward profile. Overall an advisable quantitative trading strategy.
/*backtest
start: 2024-01-01 00:00:00
end: 2024-01-31 23:59:59
period: 1h
basePeriod: 15m
exchanges: [{"eid":"Futures_Binance","currency":"BTC_USDT"}]
*/

//@version=5
strategy("Estrategia de Cruce de Medias Móviles", overlay=true)

// Medias móviles
ma30 = ta.sma(close, 30)
ma60 = ta.sma(close, 60)
ma200 = ta.sma(close, 200)

// Cruce de medias móviles
crossoverUp = ta.crossover(ma30, ma200)
crossoverDown = ta.crossunder(ma30, ma200)

// Señales de compra y venta
longCondition = crossoverUp
shortCondition = crossoverDown

// Ejecución de órdenes
if (longCondition)
    strategy.entry("Buy", strategy.long)
    strategy.exit("Cover", "Buy", stop=close - 40.000, limit=close + 40.000)
if (shortCondition)
    strategy.entry("Sell", strategy.short)
    strategy.exit("Cover", "Sell", stop=close + 40.000, limit=close - 40.000)

// Plot de las medias móviles
plot(ma30, color=color.blue, title="MA 30")
plot(ma60, color=color.orange, title="MA 60")
plot(ma200, color=color.green, title="MA 200")

// Condiciones para cerrar la posición contraria
if (strategy.position_size > 0)
    if (crossoverDown)
        strategy.close("Buy")
if (strategy.position_size < 0)
    if (crossoverUp)
        strategy.close("Sell")
- Dual Exponential Moving Average Trend Following Strategy
- DMI Balance Buy/Sell Strategy
- Moving Average Displaced Envelope Strategy
- Market Potential Ichimoku Bullish Cloud Strategy
- EMA RSI Hidden Divergence Trend Following Strategy
- Advanced Trend Tracking Strategy Based on Engulfing Pattern and Quantitative Indicators
- AlphaTrend Dual Tracking Strategy
- Fisher Yurik Trailing Stop Strategy
- Trend Following RSI Scalping Strategy
- Spiral Cross Strategy with Moving Average Confirmation
- Dual Moving Average Strategy 360°
- Open High Close Low Breakout Trading Strategy
- Double Exponential Moving Average Quant Trading Strategy
- Dynamic SMMA and SMA Crossover Strategy
- Trend Following Strategy Based on Bollinger Bands, RSI and Moving Average
- Trend Trading Strategy Based on MACD Indicator
- Stochastic & Moving Average Strategy with Double Filters
- Stoch RSI Based Trend Following Strategy
- Single Point Moving Average Breakout Strategy
- Moving Average Crossover Strategy