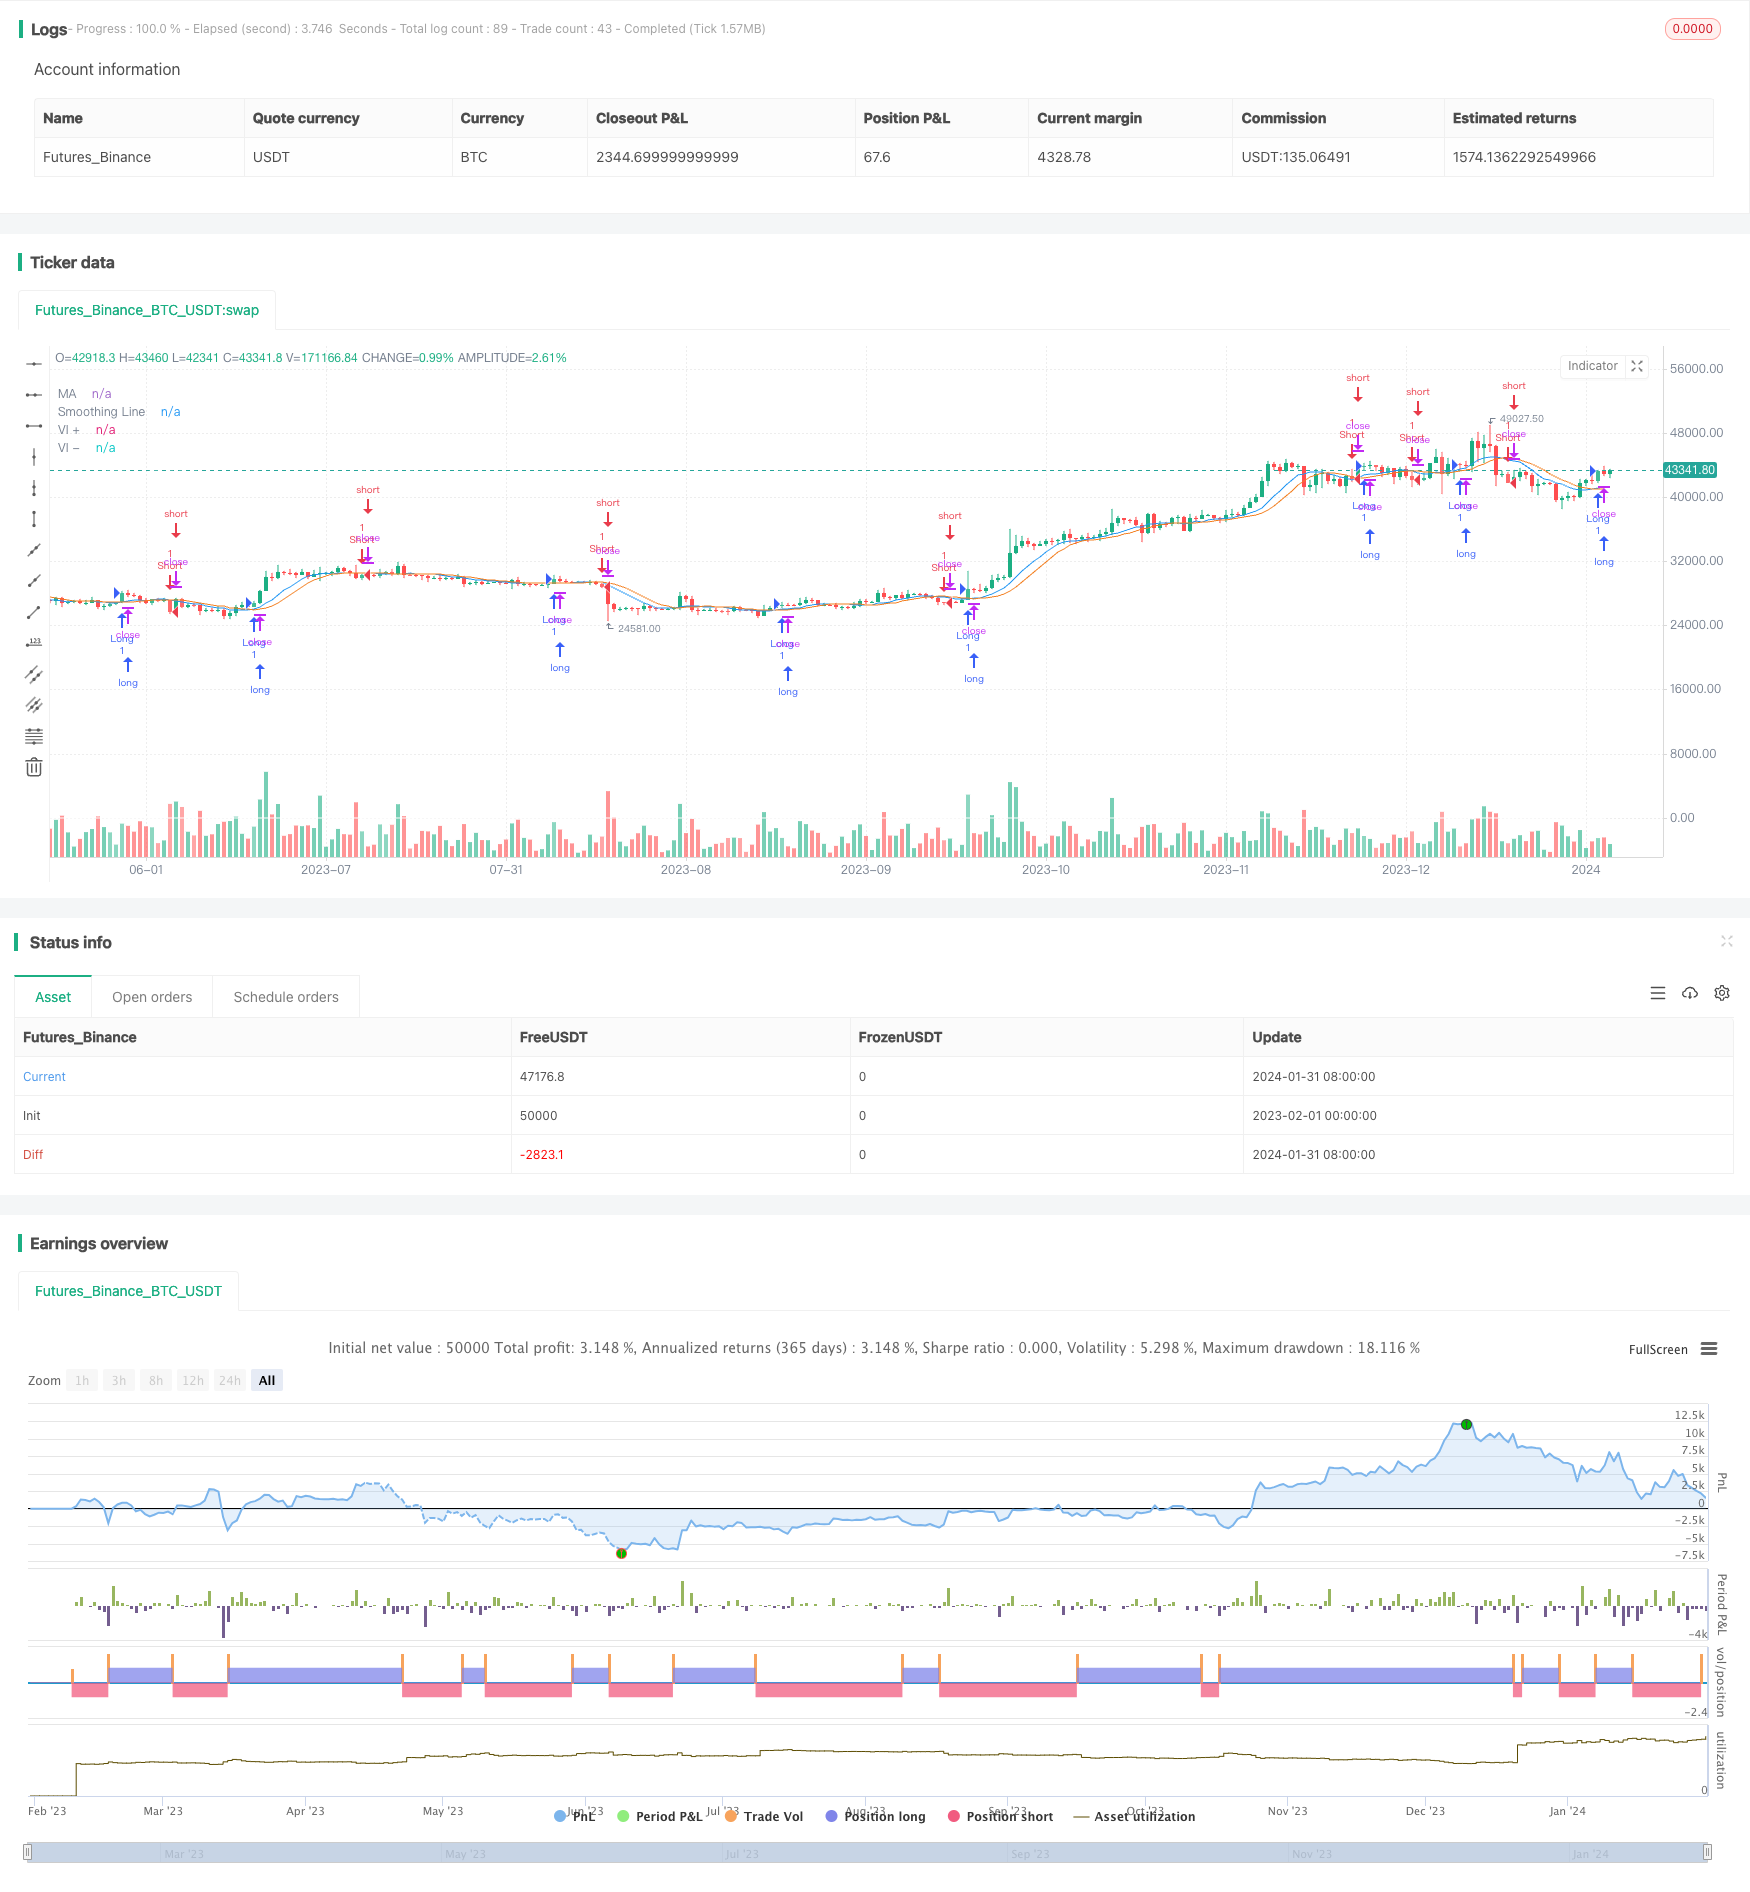
Spiral Cross Strategy with Moving Average Confirmation
Author: ChaoZhang, Date: 2024-02-02 14:50:08Tags:

Overview
This strategy combines the Vortex Indicator and Moving Average lines to identify the direction and strength of price trends in order to generate potential long and short signals. When the Vortex Positive line (VI+) crosses above the Vortex Negative line (VI-), each crossover is highlighted on the chart. If the closing price is above the Moving Average line, a long signal is generated. When VI- crosses above VI+, if the closing price is below the Moving Average line, a short signal is generated.
Strategy Logic
Vortex Indicator: Consists of two lines - Vortex Positive (VI+) and Vortex Negative (VI-). It is used to identify the direction and strength of price trends.
Moving Average (MA): Uses a chosen Moving Average method (SMA, EMA, SMMA, WMA or VWMA) to smooth the price data. The smoothed line is referred to as the “Smoothing Line”.
Determine Long and Short Signals: When VI+ crosses above VI-, each crossover is highlighted. If the close is above the Smoothing Line, a long signal is generated. When VI- crosses above VI+, if the close is below the Smoothing Line, a short signal is generated.
Advantages
Combines trend identification and smoothing to capture trends in trending markets, avoiding false signals in choppy markets.
Vortex Indicator effectively identifies trend direction and strength. Moving Averages filter out some noise.
Simple and clear strategy logic, easy to understand and implement.
Customizable parameters, adapts to different market environments.
Risks
May generate false signals and whipsaws in range-bound or trendless markets.
Inappropriate parameter settings can impact strategy performance. For example, a Moving Average that is too short has poor smoothing capability and a longer one lags in recognizing trend changes.
Unable to safeguard against extreme price swings from major unanticipated events.
Enhancements
Incorporate other indicators like volume to determine trend reliability.
Optimize parameters to balance trend-following and noise filtering of Moving Averages.
Add stop loss to control losses.
Utilize machine learning for automated parameter optimization.
Incorporate risk management modules to adjust position sizing.
Conclusion
This strategy effectively combines the Vortex Indicator and Moving Averages to capture trends. It identifies trend direction while having some noise filtering capability to reduce false signals. The logic is simple and flexible to use, performing well in trending markets. Further improvements in risk control can be achieved by incorporating more filters, optimizing parameters, and adding stop losses.
/*backtest
start: 2023-02-01 00:00:00
end: 2024-02-01 00:00:00
period: 1d
basePeriod: 1h
exchanges: [{"eid":"Futures_Binance","currency":"BTC_USDT"}]
*/

// This source code is subject to the terms of the Mozilla Public License 2.0 at https://mozilla.org/MPL/2.0/
// © DraftVenture

//@version=5
strategy("Vortex + Moving Average Strategy", overlay=true)

//Vortex settings
period_ = input.int(14, title="Vortex Length", minval=2)
VMP = math.sum( math.abs( high - low[1]), period_ )
VMM = math.sum( math.abs( low - high[1]), period_ )
STR = math.sum( ta.atr(1), period_ )
VIP = VMP / STR
VIM = VMM / STR
plot(VIP, title="VI +", color=color.white)
plot(VIM, title="VI -", color=color.white)

len = input.int(9, minval=1, title="MA Length")
src = input(close, title="Source")
offset = input.int(title="Offset", defval=0, minval=-500, maxval=500)
out = ta.sma(src, len)
plot(out, color=color.blue, title="MA", offset=offset)

ma(source, length, type) =>
    switch type
        "SMA" => ta.sma(source, length)
        "EMA" => ta.ema(source, length)
        "SMMA (RMA)" => ta.rma(source, length)
        "WMA" => ta.wma(source, length)
        "VWMA" => ta.vwma(source, length)

typeMA = input.string(title = "Method", defval = "SMA", options=["SMA", "EMA", "SMMA (RMA)", "WMA", "VWMA"], group="Smoothing")
smoothingLength = input.int(title = "Length", defval = 5, minval = 1, maxval = 100, group="Smoothing")

smoothingLine = ma(out, smoothingLength, typeMA)
plot(smoothingLine, title="Smoothing Line", color=#f37f20, offset=offset, display=display.none)

// Determine long and short conditions
longCondition = ta.crossover(VIP, VIM) and close > smoothingLine
shortCondition = ta.crossunder(VIP, VIM) and close < smoothingLine
crossCondition = ta.crossunder(VIP, VIM) or ta.crossunder(VIM, VIP)

// Strategy entry and exit logic
if longCondition
    strategy.entry("Long", strategy.long)

if shortCondition
    strategy.entry("Short", strategy.short)

bgcolor(crossCondition ? color.new(color.white, 80) : na)

// Strategy by KP
- Stop Loss and Take Profit Strategy Based on Doji Pattern
- Dual Exponential Moving Average Trend Following Strategy
- DMI Balance Buy/Sell Strategy
- Moving Average Displaced Envelope Strategy
- Market Potential Ichimoku Bullish Cloud Strategy
- EMA RSI Hidden Divergence Trend Following Strategy
- Advanced Trend Tracking Strategy Based on Engulfing Pattern and Quantitative Indicators
- AlphaTrend Dual Tracking Strategy
- Fisher Yurik Trailing Stop Strategy
- Trend Following RSI Scalping Strategy
- Gold Cross Dead Cross Quantitative Trading Strategy
- Dual Moving Average Strategy 360°
- Open High Close Low Breakout Trading Strategy
- Double Exponential Moving Average Quant Trading Strategy
- Dynamic SMMA and SMA Crossover Strategy
- Trend Following Strategy Based on Bollinger Bands, RSI and Moving Average
- Trend Trading Strategy Based on MACD Indicator
- Stochastic & Moving Average Strategy with Double Filters
- Stoch RSI Based Trend Following Strategy
- Single Point Moving Average Breakout Strategy