SMA-ATR Dynamic Trailing Stop Strategy
Author: ChaoZhang, Date: 2024-02-06 10:06:29Tags:

Overview
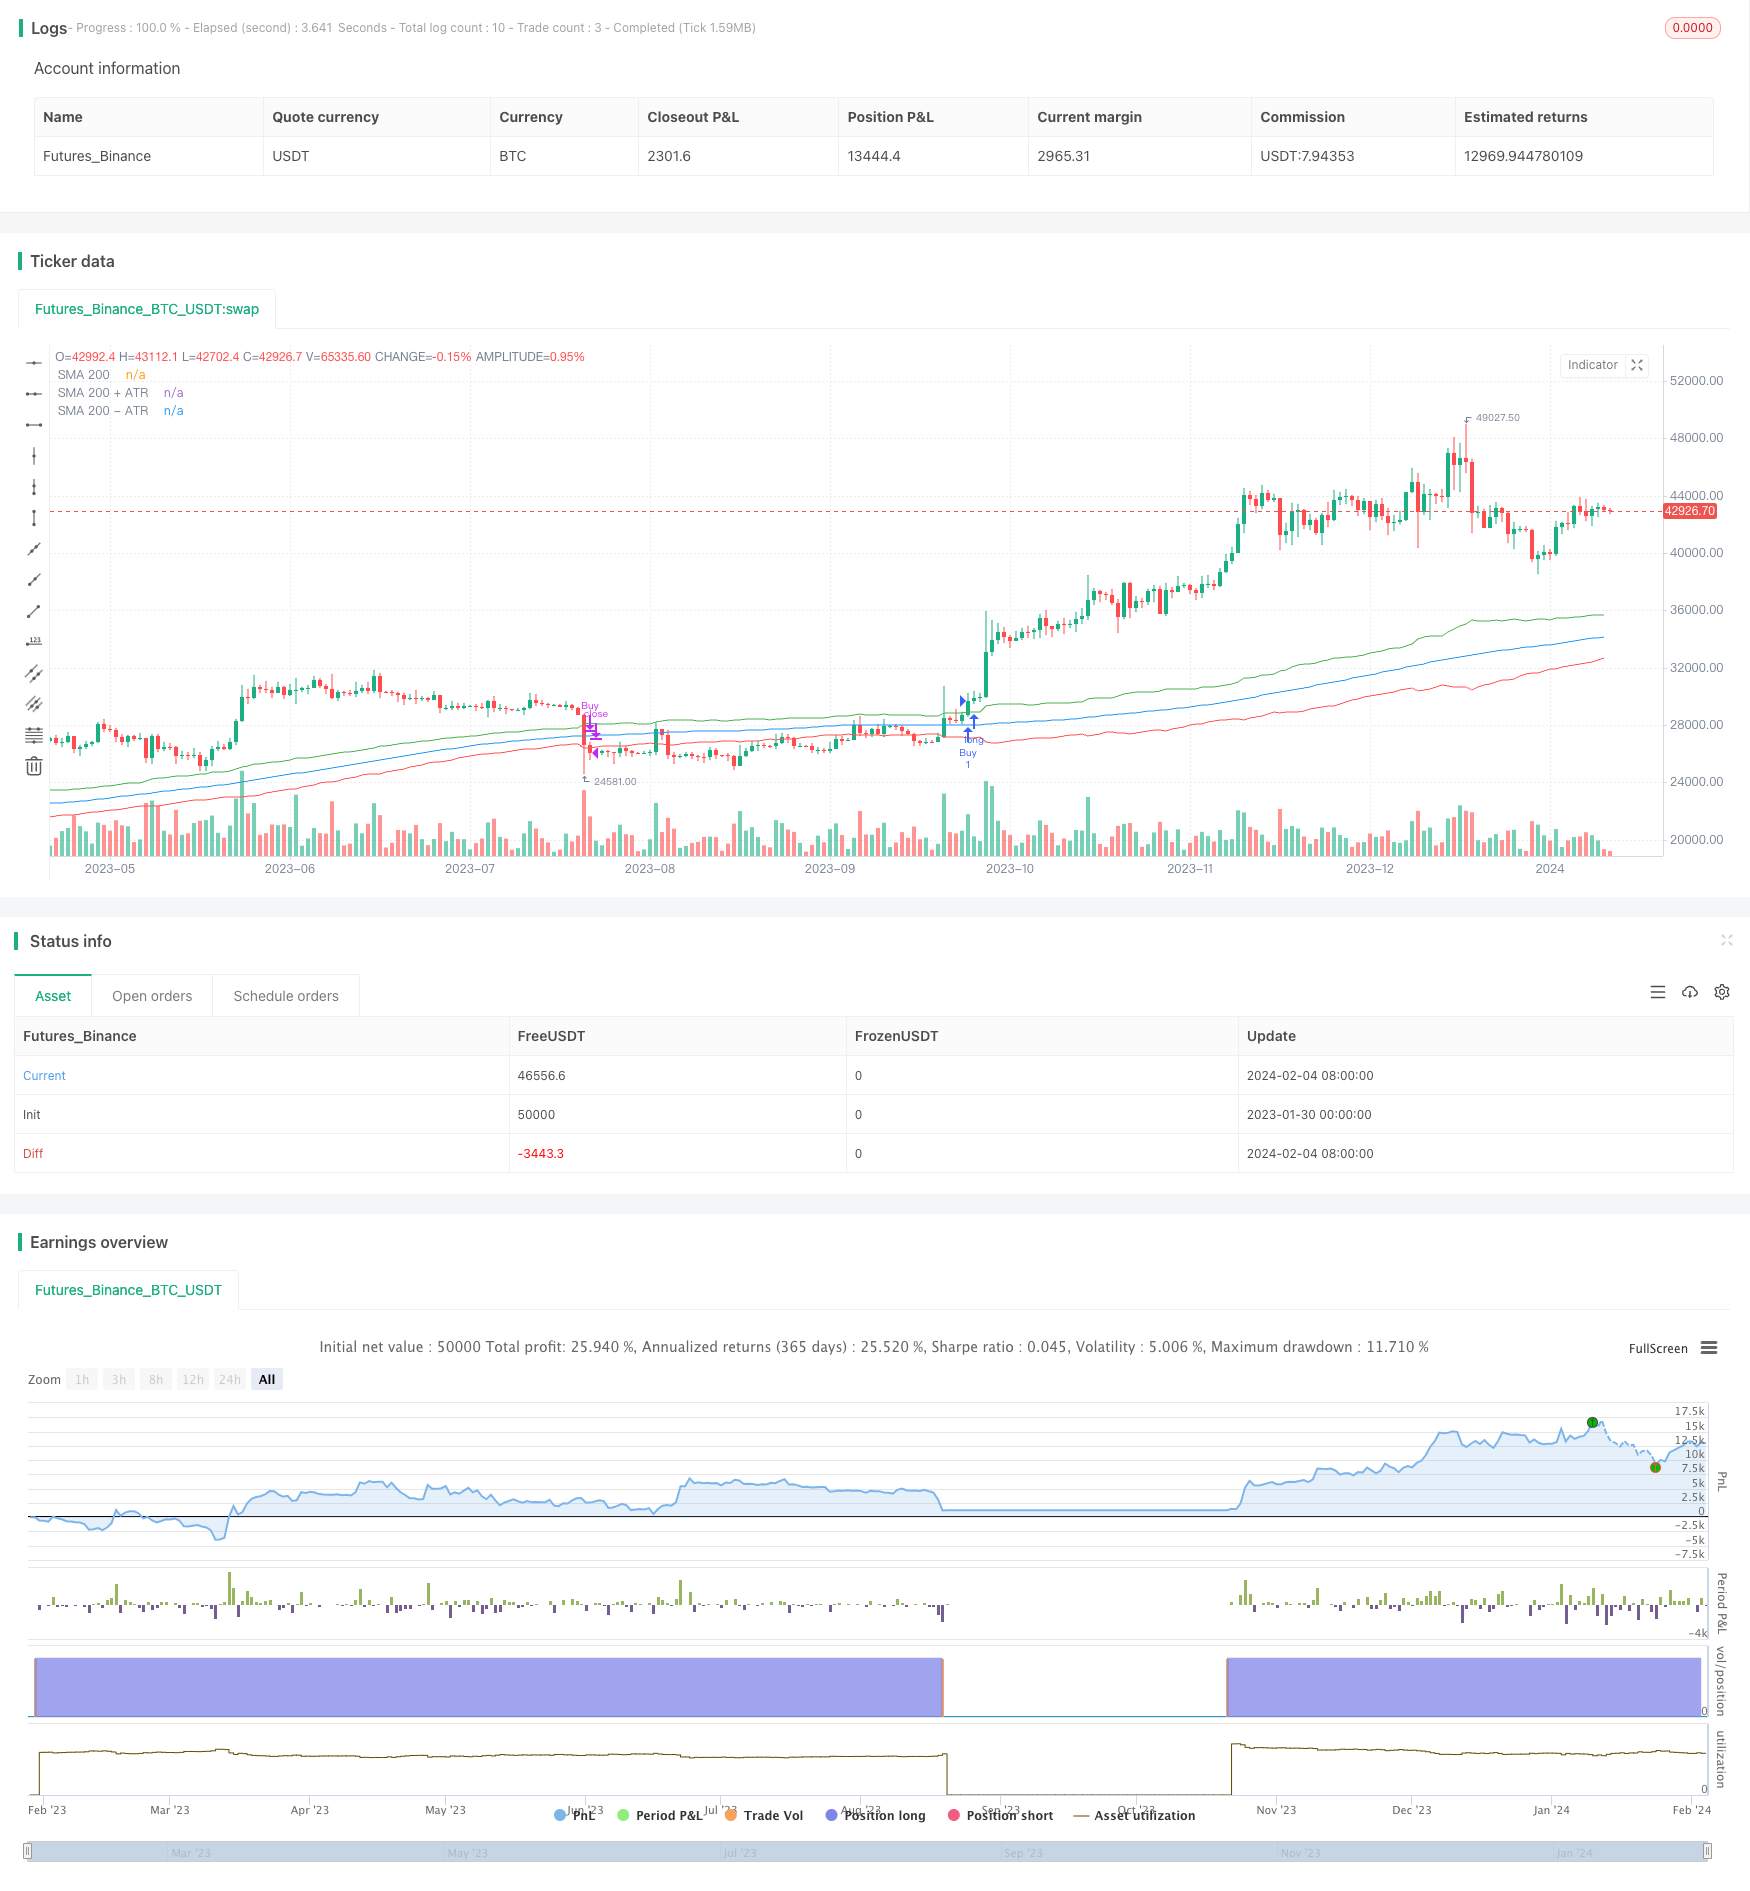
This strategy is a long-term trading strategy that sets dynamic trailing stop loss based on Simple Moving Average (SMA) and Average True Range (ATR). It combines the advantages of trend tracking and risk management to control drawdowns while maximizing profits.
Strategy Logic
Enter long when the closing price crosses above SMA 200 plus ATR 14, close the position when the closing price crosses below SMA 200 minus ATR 14. The strategy uses SMA 200 to determine the major trend direction, and sets the stop loss line dynamically with ATR 14, realizing dynamic trailing stop loss. Specifically, the buy signal is triggered when the closing price breaks through SMA 200 plus ATR 14. This breakout means the current market stays in upward trend. The stop loss signal is triggered when the closing price breaks through SMA 200 minus ATR 14. This breakout means the upward trend is broken.
Advantage Analysis
This strategy combines the advantages of both SMA and ATR indicators. SMA 200 filters market noise and locks in primary trend direction. ATR 14 sets stop loss line based on the volatility of recent two weeks, realizing dynamic trailing stop loss function. This achieves sustained profitability within the trend, while also controlling drawdowns effectively. The overall advantages are:
Higher profit/loss ratio. Following trends and controlling risks leads to higher profit/loss ratio.
Controllable drawdowns. The dynamic stop loss with ATR reduces the impact of sporadic market shocks.
Simple parameters. Only two parameters balance risks and returns, avoiding overfitting.
Risk Analysis
Some risks of this strategy should be concerned:
Trend reversal risk. The strategy itself cannot identify trend reversal, which may lead to huge losses if sudden trend turning appears.
SMA lagging risk. SMA has some lagging effect which cannot reflect trend change instantly.
ATR parameter risk. Improper ATR parameter setting can influence strategy performance.
Solutions: 1. Add other indicators to determine trend reversal, e.g. MACD. 2. Test different parameter combinations to find the optimal balance.
Optimization Directions
This strategy can be further optimized from the following aspects:
Test different combinations of SMA and ATR parameters to find the optimal one.
Add more technical indicators to judge reversal, e.g. MACD.
Optimize the stop loss mechanism with trailing stop loss, moving stop loss etc.
Combine fundamental factors to avoid buying up stocks with weak fundamentals.
Conclusion
This strategy integrates trend tracking and dynamic risk management methods to optimize stop loss and take profit during long holding periods. It features high profit/loss ratio, controllable drawdowns and balanced risk/return profile. But it also has some trend reversal risks and difficulty in parameter optimization. Overall, this simple and effective strategy provides a long-term trading idea worthy of further testing and optimization for quantitative trading.
/*backtest
start: 2023-01-30 00:00:00
end: 2024-02-05 00:00:00
period: 1d
basePeriod: 1h
exchanges: [{"eid":"Futures_Binance","currency":"BTC_USDT"}]
*/

//@version=5
strategy("SMA+ATR Strategie", overlay=true)

// Benutzer-Inputs für SMA, ATR und die Anzeigeoption
smaLength = input(200, title="SMA Länge")
atrLength = input(14, title="ATR Länge")
showSMAandATR = input(true, title="Zeige SMA und ATR-Bänder")

// Berechnung von SMA und ATR
sma = ta.sma(close, smaLength)
atr = ta.atr(atrLength)

// Kauf- und Verkaufslogik basierend auf SMA und ATR
buyCondition = close > sma + atr
sellCondition = close < sma - atr

// Variable zum Speichern des Eintrittspreises
var float entryPrice = na

// Kauf- und Verkaufssignale
if (buyCondition)
    strategy.entry("Buy", strategy.long)
    entryPrice := close // Speichere den Eintrittspreis

if (sellCondition)
    // Nur wenn ein Kauf stattgefunden hat
    if not na(entryPrice)
        // Berechne die Performance seit dem Kaufsignal
        performanceSinceBuy = ((close - entryPrice) / entryPrice) * 100
        // Anzeigen der Performance
        // Wähle die Box-Farbe basierend auf dem Vorzeichen der Performance
        plColor = performanceSinceBuy >= 0 ? color.green : color.red
        // Anzeigen der Performance in der entsprechenden Farbe
        plBox = "P/L: " + str.tostring(performanceSinceBuy, "#.##") + "%"
        label.new(bar_index, high, text=plBox, color=plColor, textcolor=color.white, style=label.style_label_center, yloc=yloc.price)

    // Schließe den Trade und setze den Eintrittspreis zurück
    strategy.close("Buy")
    entryPrice := na

// Optionale Anzeige von SMA und ATR-Band
plot(showSMAandATR ? sma : na, color=color.blue, title="SMA 200")
plot(showSMAandATR ? sma + atr : na, color=color.green, title="SMA 200 + ATR")
plot(showSMAandATR ? sma - atr : na, color=color.red, title="SMA 200 - ATR")
- TD Sequential Dual-Direction S/R Trading Strategy
- SuperTrend Quantitative Trading Strategy for Bitcoin
- A Short-term Strategy Combining RSI Indicator and Price Breakthrough
- Richard's Turtle Trading Strategy
- Dynamic Slope Trend Line Trading Strategy
- Advanced RSI Indicator Trading Strategy
- RSI Indicator Cross Cycle Profit and Stop Loss Strategy
- Trend Tracking Strategy Based on Moving Average Crossover
- RSI and Bollinger Bands Fusion Trading Strategy for LTC
- Optimized Momentum Moving Average Crossover Strategy
- Reversal Tracking Strategy
- Dual Reversal Arbitrage Strategy
- Kama and Moving Average Based Trend Following Strategy
- Price Channel and Moving Average Based Trend Following Strategy
- RSI Dynamic Position Averaging Strategy
- Bollinger Bands and RSI Combination Strategy
- Dynamic Dual Exponential Moving Average Trading Strategy
- A Dual Reversal Momentum Index Trading Strategy
- Bottom Hunter Strategy
- Bollinger Band Strategy with Date Range Selection