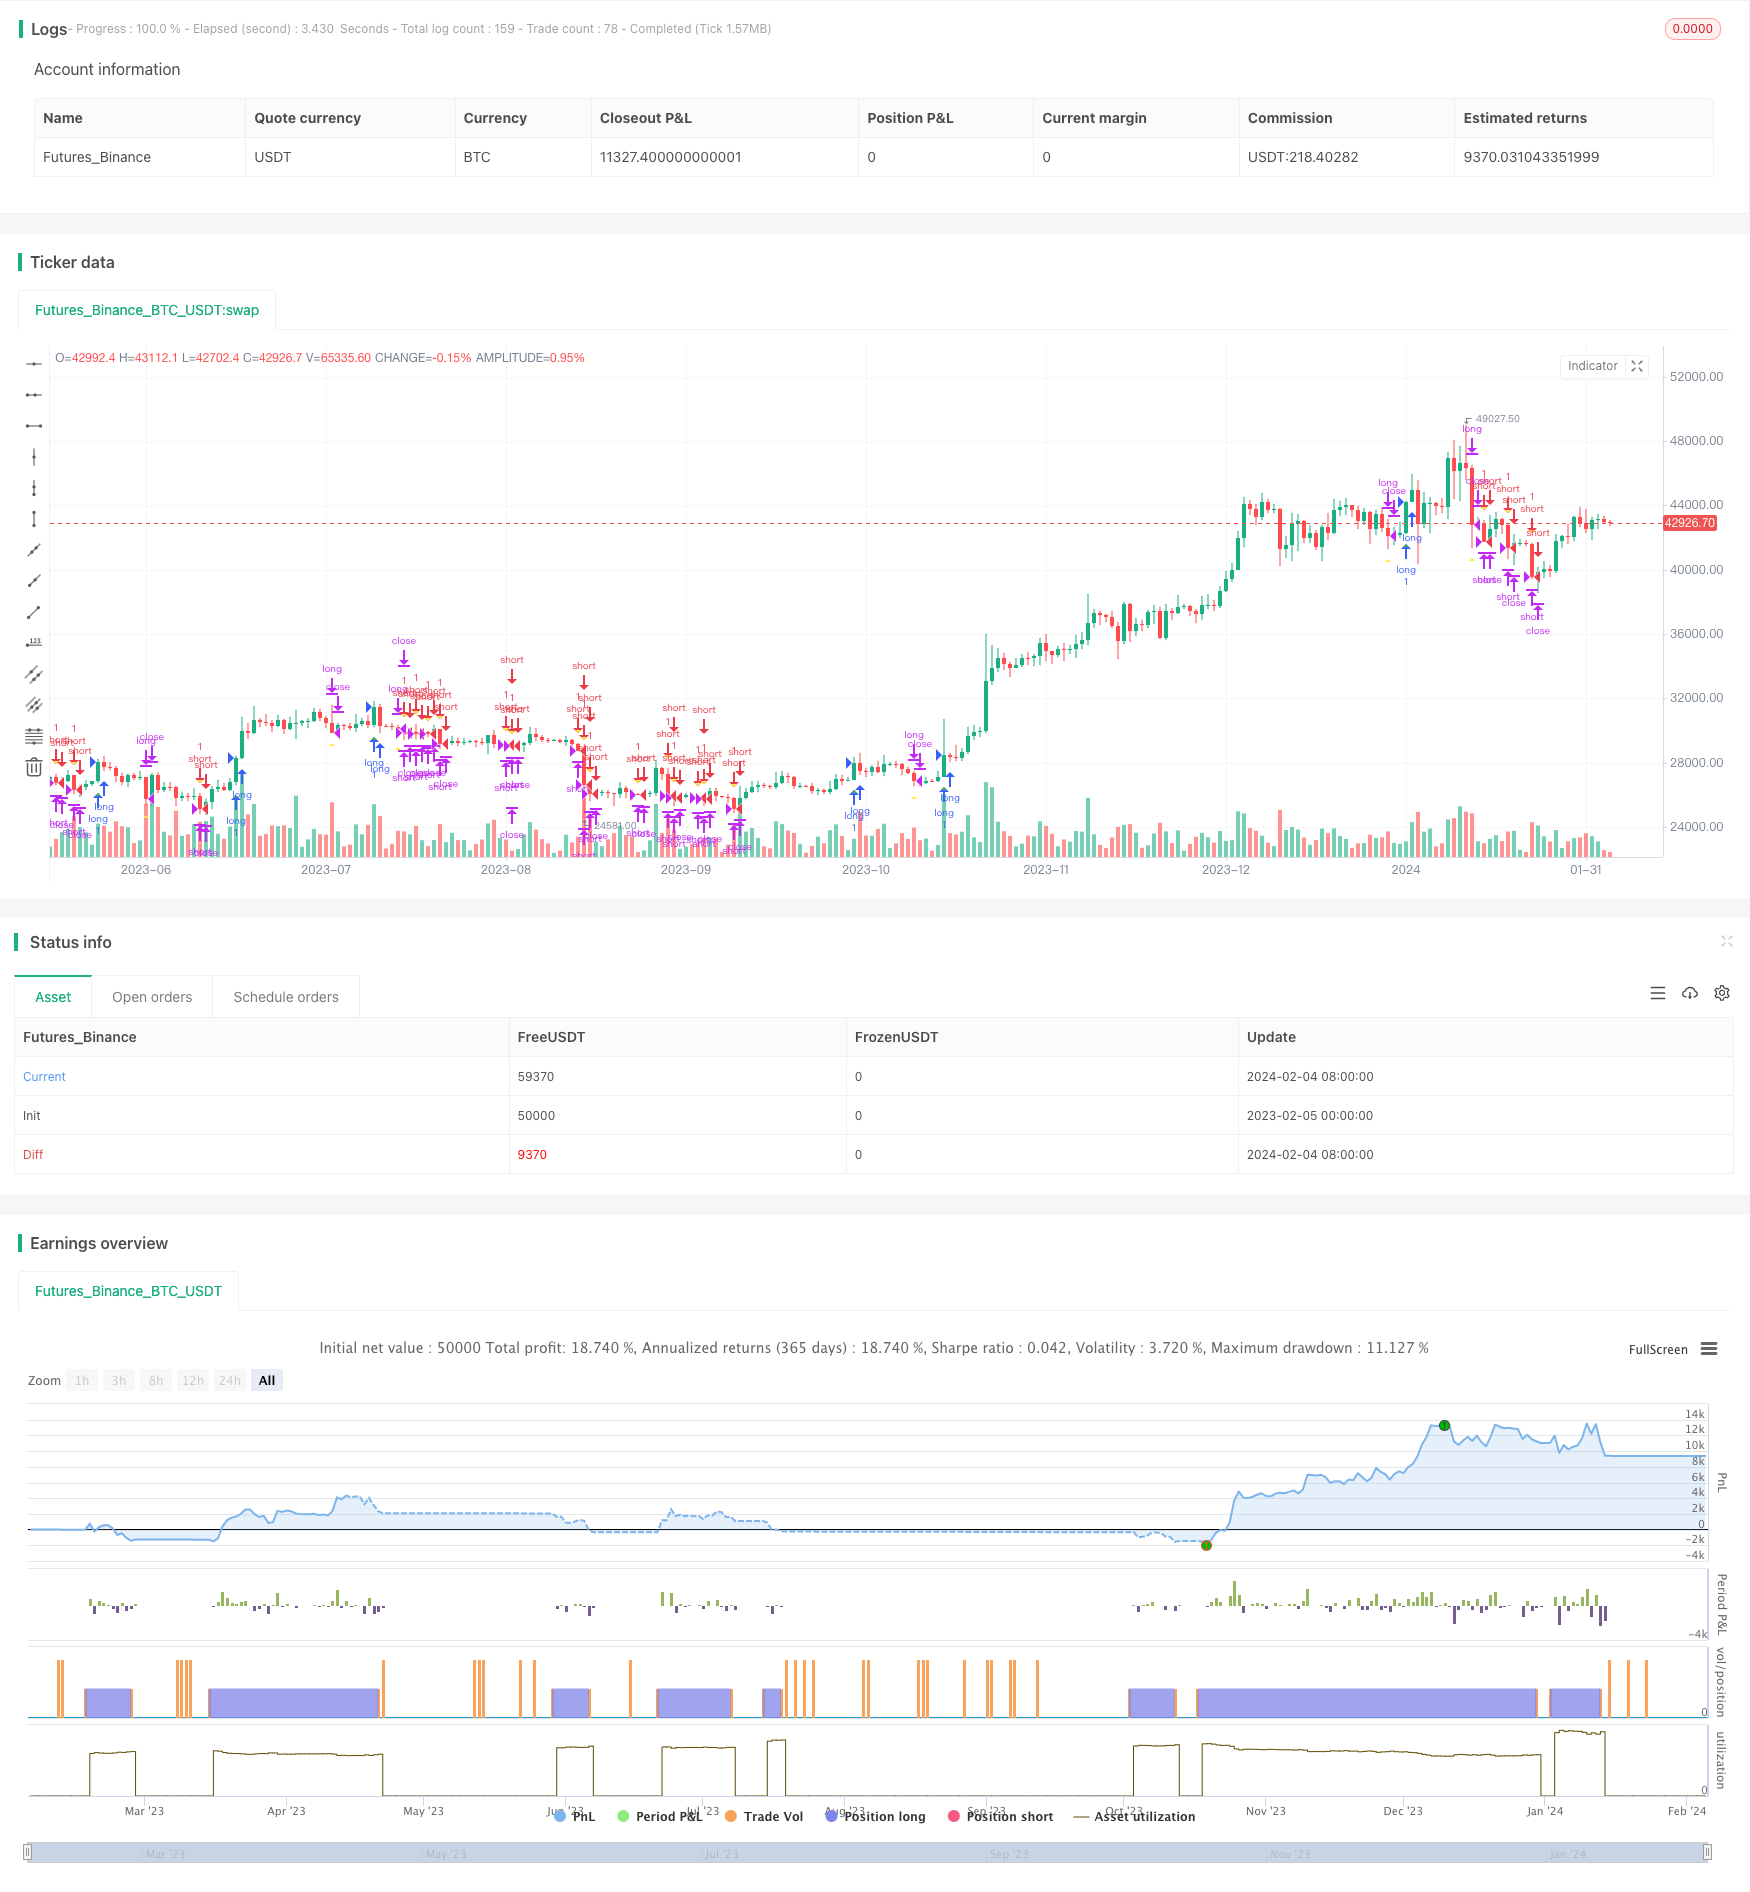
Richard's Turtle Trading Strategy
Author: ChaoZhang, Date: 2024-02-06 11:56:47Tags:

Overview
Richard’s Turtle Trading Strategy is a trading strategy based on Richard Dennis’s turtle trading techniques. It utilizes price breakouts to track trends. It goes long when price breaks through 20-day high and goes short when price breaks through 20-day low.
Strategy Logic
The core logic of Richard’s turtle trading strategy is to track trends based on price breakouts. Specifically, the strategy continuously monitors the highest (_20_day_highest) and lowest (_20_day_lowest) prices in the last 20 days. When the closing price breaks through 20-day high, it signals an upward breakthrough, triggering long order. When the closing price falls below 20-day low, it signals a downward breakthrough, triggering short order.
After entering positions, the strategy uses Average True Range (ATR) to calculate stop loss price. It also tracks 10-day high and low prices for slippage stop loss. When long stop loss or slippage stop loss is triggered, it will close long position. When short stop loss or slippage stop loss is triggered, it will close short position.
Advantages
Richard’s turtle trading strategy has the following advantages:
- It automatically tracks trends using price breakouts. It can automatically identify trend reversals and adjust positions accordingly.
- ATR stop loss mechanism effectively controls single stop loss.
- Slippage stop loss mechanism locks in some profits and reduces drawdowns.
- The strategy logic is simple and easy to understand for beginners.
- No need to predict market trends or complex calculations, just simple rule-based trading.
Risks
There are also some risks with Richard’s turtle trading strategy:
- Breakout trading is prone to being trapped, sometimes generating excessive trading frequency.
- ATR and slippage stop loss may be too strict, causing premature stop loss occasionally.
- It only utilizes price data without combining other factors to predict trend continuity.
- Backtest overfit risk, real trading results may be poor.
To mitigate these risks, we can optimize entry conditions with more indicators to predict trends; adjust stop loss algorithms to reduce stop loss frequency.
Optimization Directions
Richard’s turtle trading strategy can be optimized in the following aspects:
- Optimize parameters to find optimum parameter combinations, such as adjusting calculation cycle or testing different ATR multiples.
- Incorporate more indicators or machine learning algorithms to judge trend continuity, such as moving averages, momentum indicators etc.
- Optimize stop loss methods, such as testing flexible slippage stop loss, trailing stop loss etc.
- Combine sentiment indicators, news and more information to predict market movements. This can filter out some false breakouts.
Conclusion
Richard’s turtle trading strategy is a very typical breakout trend following strategy. It is simple and practical, good for beginners to learn, and a quant trading paradigm. The strategy can be optimized in many ways to reduce risks and increase profitability. Overall, Richard’s turtle strategy is very enlightening.
/*backtest
start: 2023-02-05 00:00:00
end: 2024-02-05 00:00:00
period: 1d
basePeriod: 1h
exchanges: [{"eid":"Futures_Binance","currency":"BTC_USDT"}]
*/

// This source code is subject to the terms of the Mozilla Public License 2.0 at https://mozilla.org/MPL/2.0/
// © melodyera0822

//@version=4
strategy("Richard Strategy", overlay=true)

// User input
variable_for_stoploss = input(4,title="stop loss var")
lenght = input(20,title="lenght")

// high_low
_20_day_highest = highest(nz(close[1]), lenght)
_20_day_lowest = lowest(nz(close[1]), lenght)

_10_day_low = lowest(nz(close[1]), lenght/2)
_10_day_high = highest(nz(close[1]), lenght/2)

//indicators
atr20 = atr(20)
ema_atr20 = ema(atr20,20)

//vars
var traded = "false"
var buy_sell = "none"
var buyExit = false
var sellExit = false
var stoploss = 0

buyCon = close > _20_day_highest and traded == "false"
plotshape(buyCon,style = shape.triangleup,location = location.belowbar, color = color.green )
if (buyCon)
    strategy.entry("long", strategy.long, when = buyCon)
    traded := "true"
    buy_sell := "buy"
    stoploss := round(close - variable_for_stoploss * ema_atr20)

sellCon = close < _20_day_lowest and  traded == "false"
plotshape(sellCon,style = shape.triangledown, color = color.red )
if (sellCon)
    strategy.entry("short", strategy.short)
    traded := "true"
    buy_sell := "sell"
    stoploss := round(close - variable_for_stoploss * ema_atr20)

if traded == "true"
    if buy_sell == "buy" and ((close<stoploss)or(close<_10_day_low))
        strategy.close("long")
        buyExit := true
        traded := "false"

    if buy_sell == "sell" and ((close>stoploss)or(close>_10_day_high))
        strategy.close("short")
        sellExit := true
        traded := "false"

plotshape(buyExit,style = shape.triangleup,location = location.belowbar, color = color.yellow )
buyExit := false
plotshape(sellExit,style = shape.triangledown, color = color.yellow )
sellExit := false
- Crossing Moving Average Breakout Strategy
- SuperTrend Trailing Stop Strategy Based on Heikin Ashi
- Dual Moving Average With Momentum Breakout Strategy
- Bollinger Band Breakout Strategy Based on VWAP
- Fibonacci Retracement Dynamic Stop Loss Strategy
- Dynamic EMA and MACD Crossover Strategy
- Double Momentum Index and Reversal Hybrid Strategy
- TD Sequential Dual-Direction S/R Trading Strategy
- SuperTrend Quantitative Trading Strategy for Bitcoin
- A Short-term Strategy Combining RSI Indicator and Price Breakthrough
- Dynamic Slope Trend Line Trading Strategy
- Advanced RSI Indicator Trading Strategy
- RSI Indicator Cross Cycle Profit and Stop Loss Strategy
- Trend Tracking Strategy Based on Moving Average Crossover
- RSI and Bollinger Bands Fusion Trading Strategy for LTC
- Optimized Momentum Moving Average Crossover Strategy
- SMA-ATR Dynamic Trailing Stop Strategy
- Reversal Tracking Strategy
- Dual Reversal Arbitrage Strategy
- Kama and Moving Average Based Trend Following Strategy