Overview
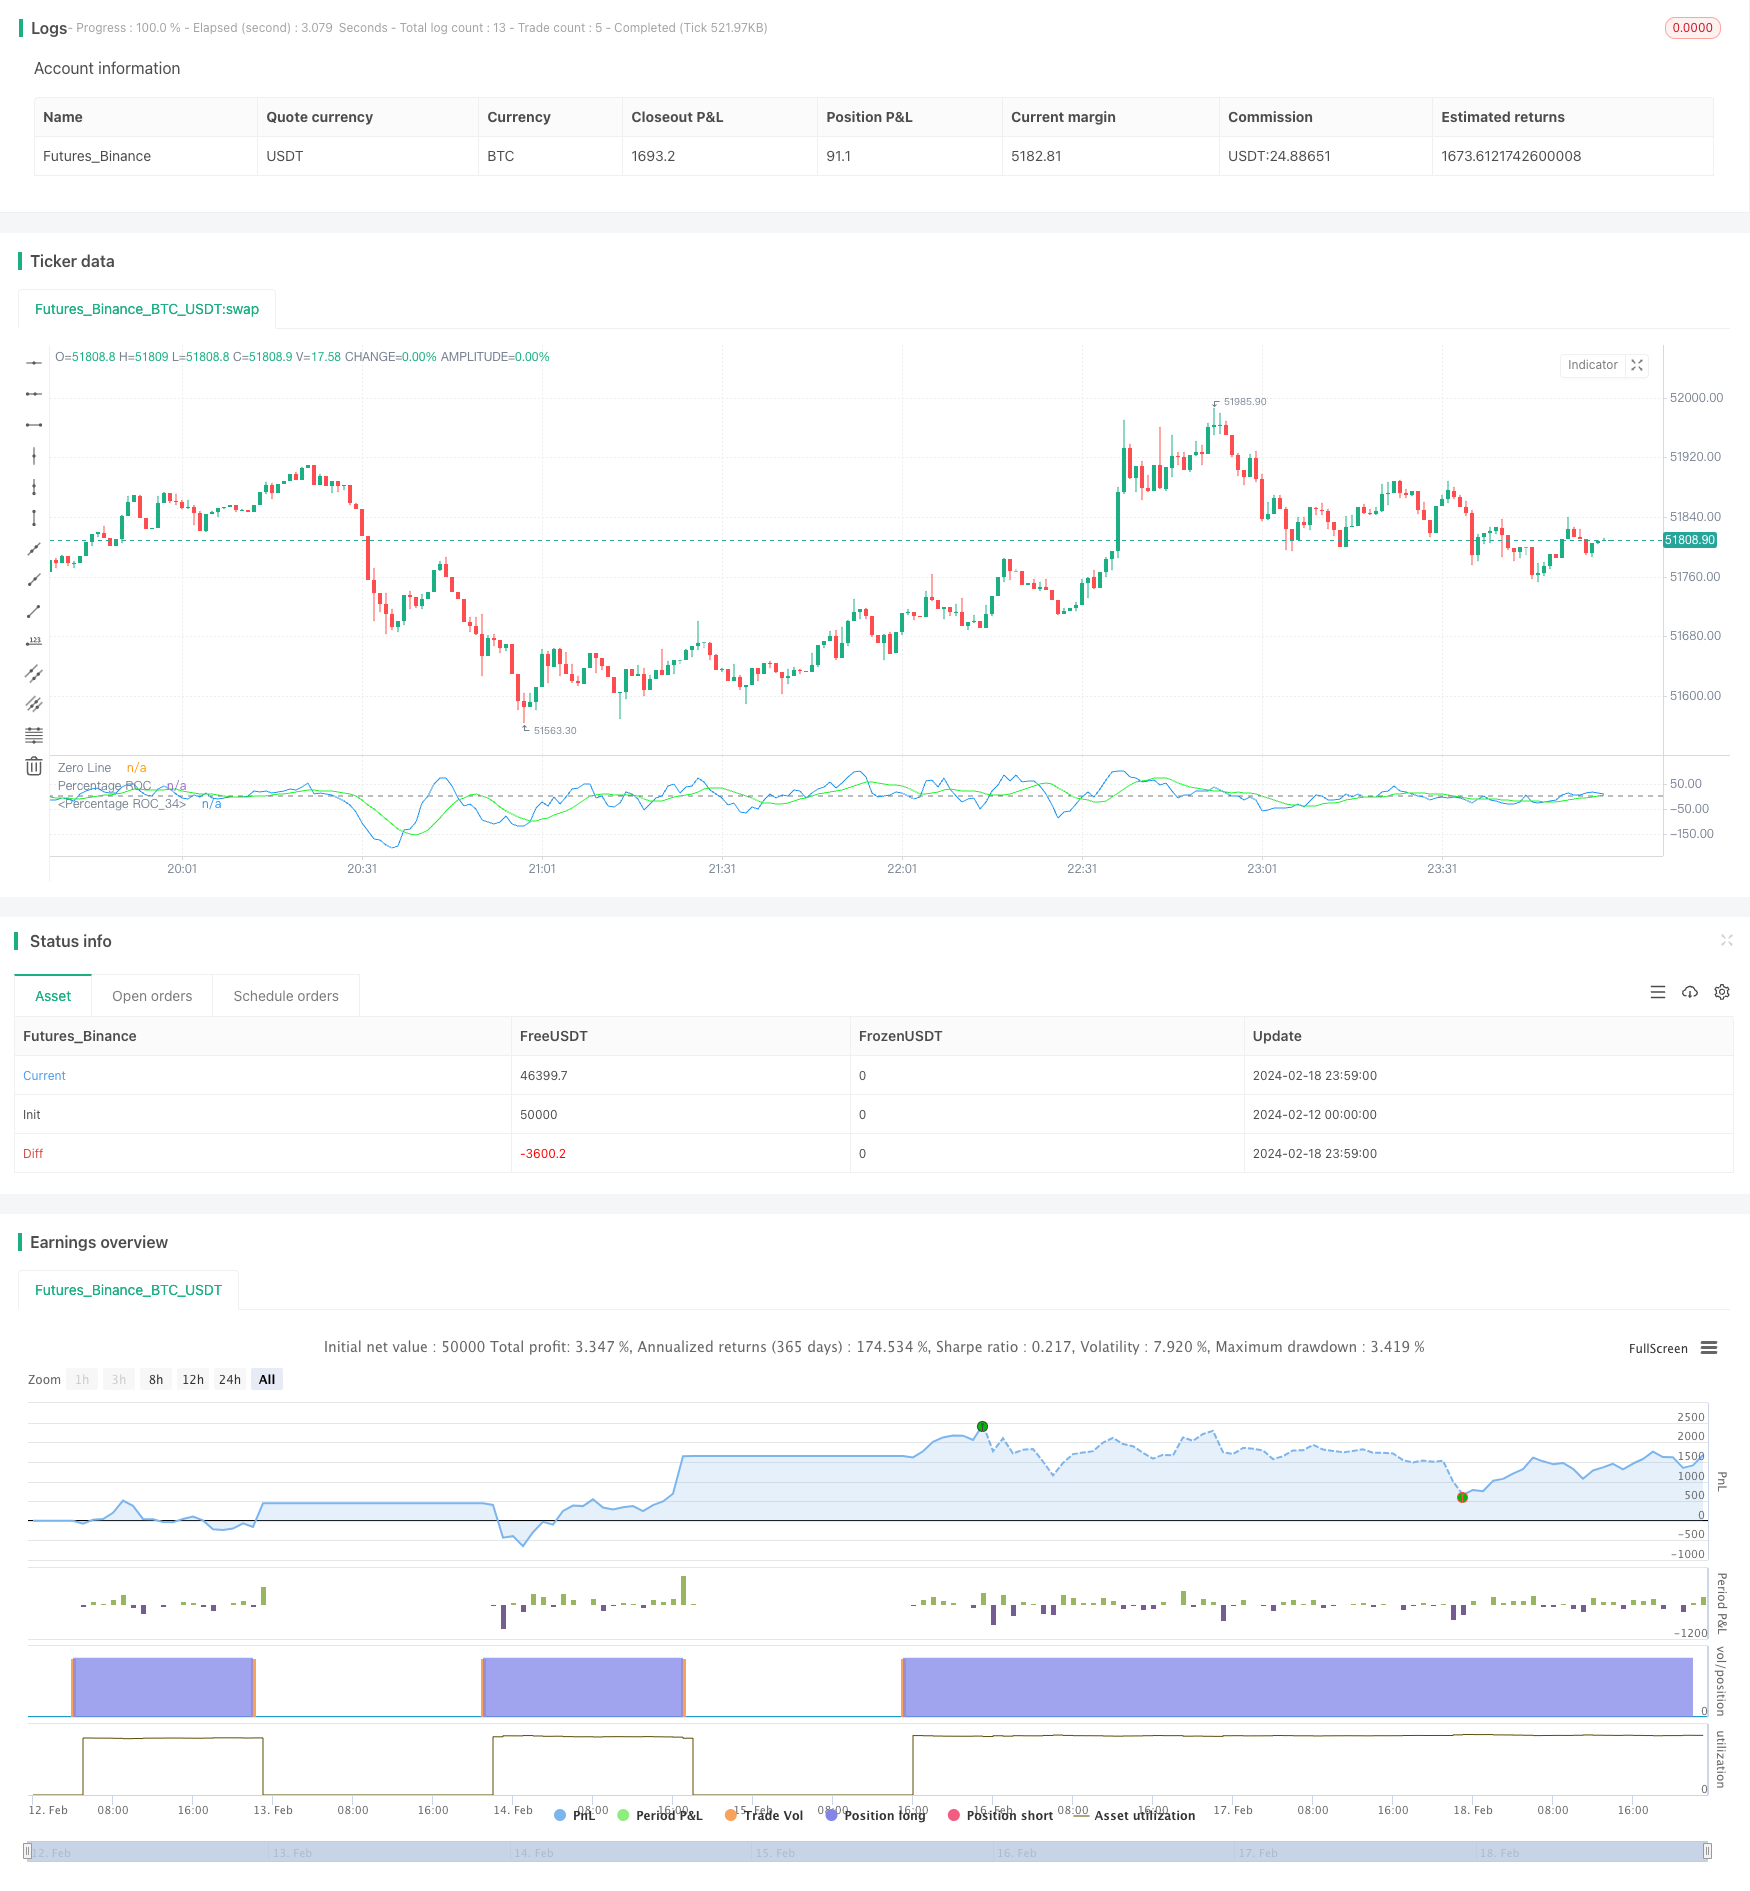
This strategy optimizes the original Rate of Change (ROC) strategy. Compared with the original ROC strategy, this strategy has the following optimizations:
- Introduce the maximum historical ROC value for dynamic comparison with the current ROC to obtain relative momentum value.
- Smooth the relative momentum value to generate signals.
- Add buy and sell signal thresholds.
Through these optimization measures, many invalid signals can be filtered out to make the strategy more stable and reliable.
Strategy Principle
The core indicator of this strategy is Rate of Change (ROC). ROC measures the rate of change in stock prices over a certain period. This strategy first calculates the ROC value over a period of 9. Then it records the maximum value of this ROC indicator in the past 200 periods and calculates the current ROC as a percentage of the maximum historical ROC to obtain the relative strength of momentum. For example, if the highest ROC in the past 200 days reached 100, then the relative strength is 80% when today’s ROC is 80.
The relative strength is smoothed by a 10-period SMA to filter out short-term fluctuations and obtain a smooth curve. When the smooth curve rises continuously for 3 days and the value is below -80%, it is considered that the stock price decline begins to slow down and the bottom sign appears, so go long; when the smooth curve falls continuously for 3 days and the value is above 80%, it is considered that the stock price increase begins to slow down and the top sign appears, so close position.
Advantage Analysis
Compared with the original ROC strategy, this strategy has the following main advantages:
- Introducing historical maximum ROC value comparison can effectively measure the relative level of momentum indicators and filter out invalid signals with absolute values that are not high enough.
- Smoothing processing filters noise and makes signals more stable and reliable.
- Setting buy and sell thresholds reduces invalid transactions.
In general, this strategy effectively processes the ROC indicator to make it more suitable for live trading.
Risk Analysis
The main risks of this strategy are:
- The ROC indicator cannot determine market trends and there are some misleadings. The strategy may fail when it encounters a bull-bear transition period.
- Buy and sell thresholds are not perfect. Setting the thresholds too high or too low will affect strategy performance.
- Improper SMA parameter settings will also affect strategy results.
To reduce the above risks, consider combining trend indicators to determine major trends; adjust threshold parameters and test optimal parameters; optimize SMA cycle parameters.
Optimization Directions
The strategy can be optimized in the following ways:
- Combine trend indicators to determine overall market direction and avoid failure during bull-bear conversion.
- Test ROC length parameters and buy and sell threshold parameters to find optimal parameter combinations.
- Optimize SMA smoothing parameters to find the best parameters.
- Increase stop loss mechanism.
Summary
This is an optimization strategy based on secondary development of the ROC indicator. It introduces means such as historical maximum value comparison, SMA smoothing, and buy and sell thresholds to filter out invalid signals and make the strategy more stable. The main advantage is the high signal quality which is suitable for live trading. Follow-up improvements can be made from combining trends, parameter optimization and so on to further improve strategy performance.
/*backtest
start: 2024-02-12 00:00:00
end: 2024-02-19 00:00:00
period: 1m
basePeriod: 1m
exchanges: [{"eid":"Futures_Binance","currency":"BTC_USDT"}]
*/

//@version=5
strategy(title="Rate Of Change Mod Strategy", shorttitle="ROC", format=format.price, precision=2)
//length = input.int(9, minval=1)
//source = input(close, "Source")
//roc = 100 * (source - source[length])/source[length]
//plot(roc, color=#2962FF, title="ROC")
//hline(0, color=#787B86, title="Zero Line")

length = input.int(9, minval=1, title="Length")
maxHistory = input(200, title="Max Historical Period for ROC")
lenghtSmooth = input.int(10, minval=1, title="Length Smoothed ROC")
lenghtBUY = input.int(-80, title="Buy Threshold")
lenghtSELL = input.int(80, title="Buy Threshold")

source = close
roc = 100 * (source - source[length]) / source[length]

// Calculate the maximum ROC value in the historical period
maxRoc = ta.highest(roc, maxHistory)

// Calculate current ROC as a percentage of the maximum historical ROC
rocPercentage = (roc / maxRoc) * 100


rocPercentageS = ta.sma(rocPercentage, lenghtSmooth)
if ta.rising(rocPercentageS, 3) and rocPercentageS < lenghtBUY
    strategy.entry("Buy", strategy.long)

if ta.falling(rocPercentageS, 3) and rocPercentageS > lenghtSELL
    strategy.close("Buy")


plot(rocPercentage, color=color.new(color.blue, 0), title="Percentage ROC")
plot(rocPercentageS, color=color.new(#21f32c, 0), title="Percentage ROC")
hline(0, color=color.new(color.gray, 0), title="Zero Line")