StochRSI Reversal Trading Strategy
Author: ChaoZhang, Date: 2024-02-26 14:17:36Tags:

Overview
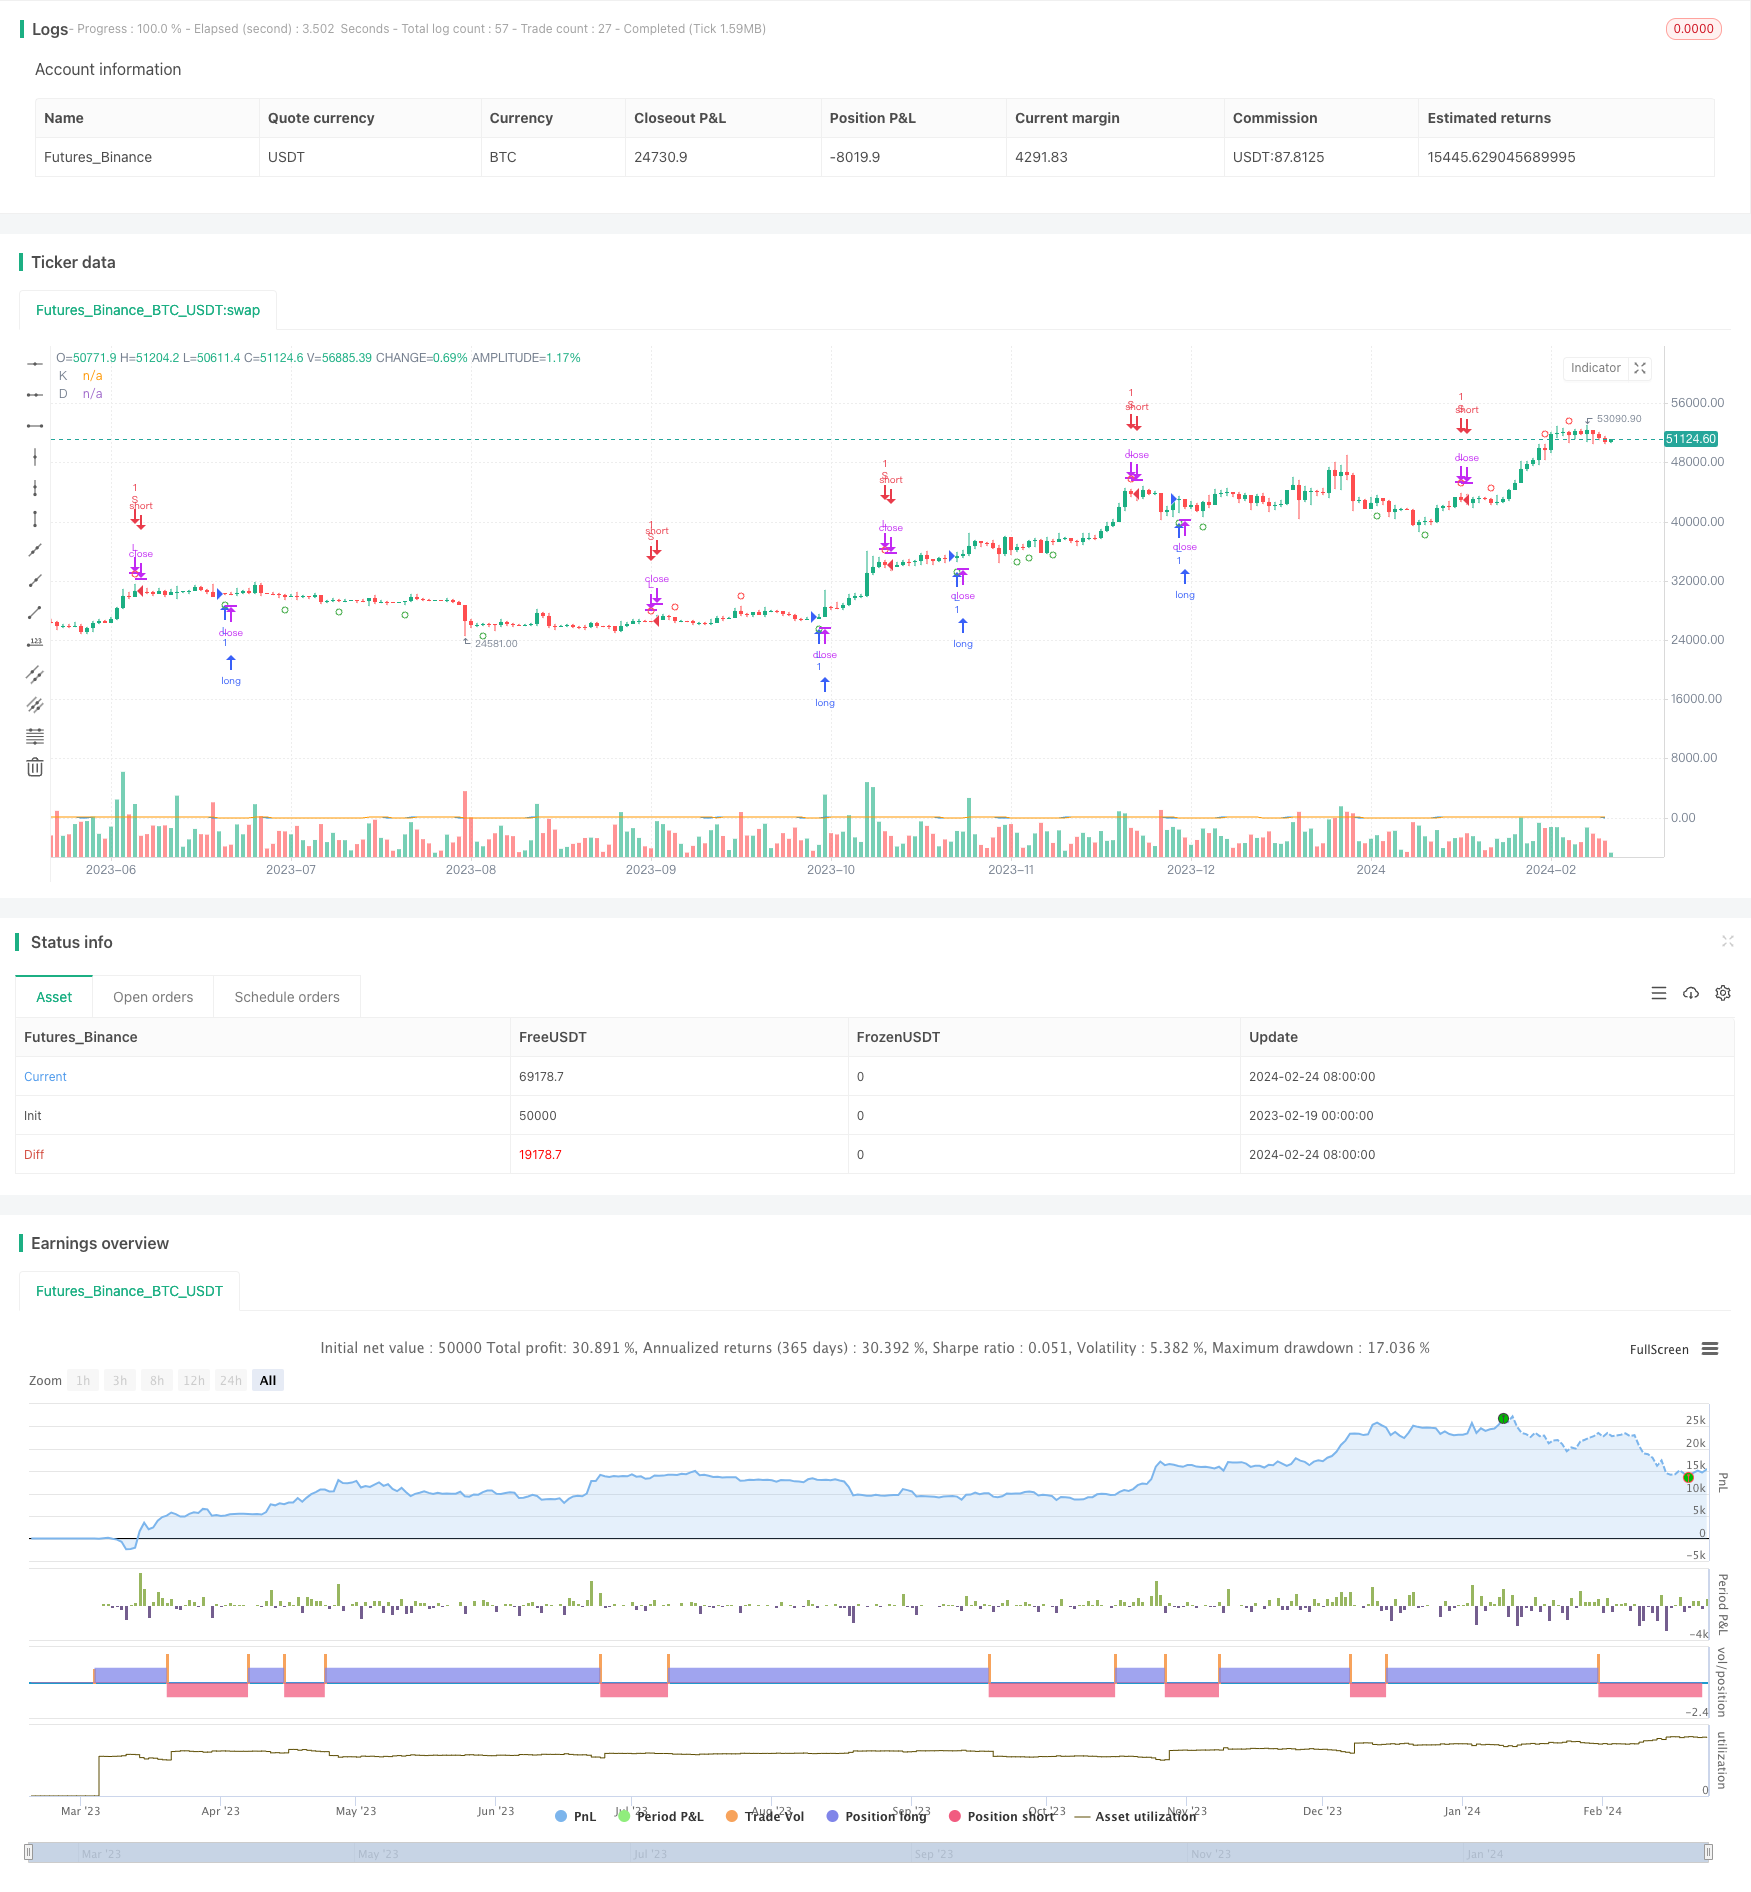
The StochRSI reversal trading strategy is a quantitative trading strategy that combines the Stochastic RSI and RSI indicators. This strategy identifies overbought and oversold situations using the Stochastic RSI indicator and generates trading signals when the RSI indicator reverses.
Strategy Logic
The strategy first calculates the 14-day RSI indicator. Then it computes the Stochastic RSI based on the RSI, including the %K line and %D line. The %K line uses a 3-day SMA parameter, and the %D line uses a 3-day SMA of the %K line. When the %K line crosses above the %D line after falling from the overbought zone to the oversold zone, a buy signal is generated. When the %K line crosses below the %D line after rising from the oversold zone to the overbought zone, a sell signal is generated.
Advantage Analysis
By combining the Stochastic RSI and RSI indicators, this strategy can capture reversal points more precisely. Compared to a single RSI indicator, it has the following advantages:
Stochastic RSI can identify overbought and oversold conditions more clearly and filter out some noise.
Stochastic RSI combined with RSI reversals can capture the timing of reversals more accurately.
By tuning the Stochastic RSI parameters, the sensitivity of the indicator can be optimized to suit more market environments.
Risk Analysis
The strategy also contains some risks:
Reversal failure risk. The selected indicators cannot perfectly predict price reversals, so there is always a risk of failures.
Parameter optimization risk. The parameters of Stochastic RSI and RSI affect the strategy performance and need to be optimized.
Weaker performance in trending markets. Trend-following strategies typically outperform reversal strategies in trending breakout markets.
Countermeasures:
Adjust the stop loss appropriately to control single trade loss.
Search for the optimal parameter combinations using machine learning.
Combine with trend-following strategies and switch between them flexibly based on market conditions.
Optimization Directions
The strategy can also be improved in the following aspects:
Optimize the parameters of Stochastic RSI and RSI to find the best combination, possibly through machine learning.
Add stop loss logic, like exiting when the strategy is down 3% to effectively control risks.
Combine momentum factors, identify excess momentum when overbought/oversold to avoid false breakouts.
Add trend determination - stop reversal trading and start trend tracking when in trending markets.
Conclusion
The StochRSI reversal trading strategy enters trades upon the identification of overbought/oversold conditions using the combination of Stochastic RSI and RSI, aiming to capture profits from short-to-medium term random oscillations. While the strategy can improve the accuracy of reversal trading, risks like reversal failures still exist. We can further enhance the strategy by optimizing parameters, adding stop loss, determining momentum and so on to maintain higher win rates while controlling risks.
/*backtest
start: 2023-02-19 00:00:00
end: 2024-02-25 00:00:00
period: 1d
basePeriod: 1h
exchanges: [{"eid":"Futures_Binance","currency":"BTC_USDT"}]
*/

//@version=4
strategy("StochRSIStrategy", overlay=true)

// Define the K and D periods, RSI length, and overbought/oversold levels
K = input(3, title="%K")
D = input(3, title="%D")
rsiLength = input(14, title="RSI Length")
stochLength = input(14, title="Stoch Length")
overbought = input(80, title="Overbought Level")
oversold = input(20, title="Oversold Level")

// Calculate the RSI
rsi = rsi(close, rsiLength)

// Calculate Stochastic RSI
stochRsi = stoch(rsi, rsi, rsi, stochLength)
Kline = sma(stochRsi, K)
Dline = sma(Kline, D)

// Plot Stochastic RSI
plot(Kline, title="K", color=color.blue)
plot(Dline, title="D", color=color.orange)

// Define bullish and bearish conditions
bullCond = (Kline < oversold) and (crossover(Kline, Dline))
bearCond = (Kline > overbought) and (crossunder(Kline, Dline))

// Generate and plot signals
if (bullCond)
    strategy.entry("L", strategy.long)
if (bearCond)
    strategy.close("L")

if (bearCond)
    strategy.entry("S", strategy.short)
if (bullCond)
    strategy.close("S")

// Plot signals
plotshape(series=bullCond, title="L", location=location.belowbar, color=color.green, style=shape.circle, size=size.small)
plotshape(series=bearCond, title="S", location=location.abovebar, color=color.red, style=shape.circle, size=size.small)
- Vortex Trend Reversal Strategy
- Momentum Tracking Dual-EMA Crossover Strategy
- Dynamic Self-Adaptive Kaufman Moving Average Trend Tracking Strategy
- Three Factors Model for Price Oscillation Detection
- Momentum Breakthrough EMA 34 Crossover Strategy
- Average True Range Breakout Strategy with Golden Ratio
- Adaptive Exponential Moving Average Range Strategy
- Donchian Channel Breakout Strategy
- Turtle Trading Strategy Based on Donchian Channels
- The Dual Quant Trading System
- Four DEMA Multi Timeframe Trend Strategy
- Follow The Bear Strategy
- Intelligent Accumulator Buy Strategy
- The Dual EMA Price Swing Strategy
- RSI Indicator Long Short Separation Trading Strategy
- Trend Following Quant Trading Strategy Based on Moving Average
- Inside Bar Breakout Strategy
- Gold Standard Quantitative Trading Strategy
- The Dual Reversal Strategy
- The Order Block Momentum Breakout Strategy