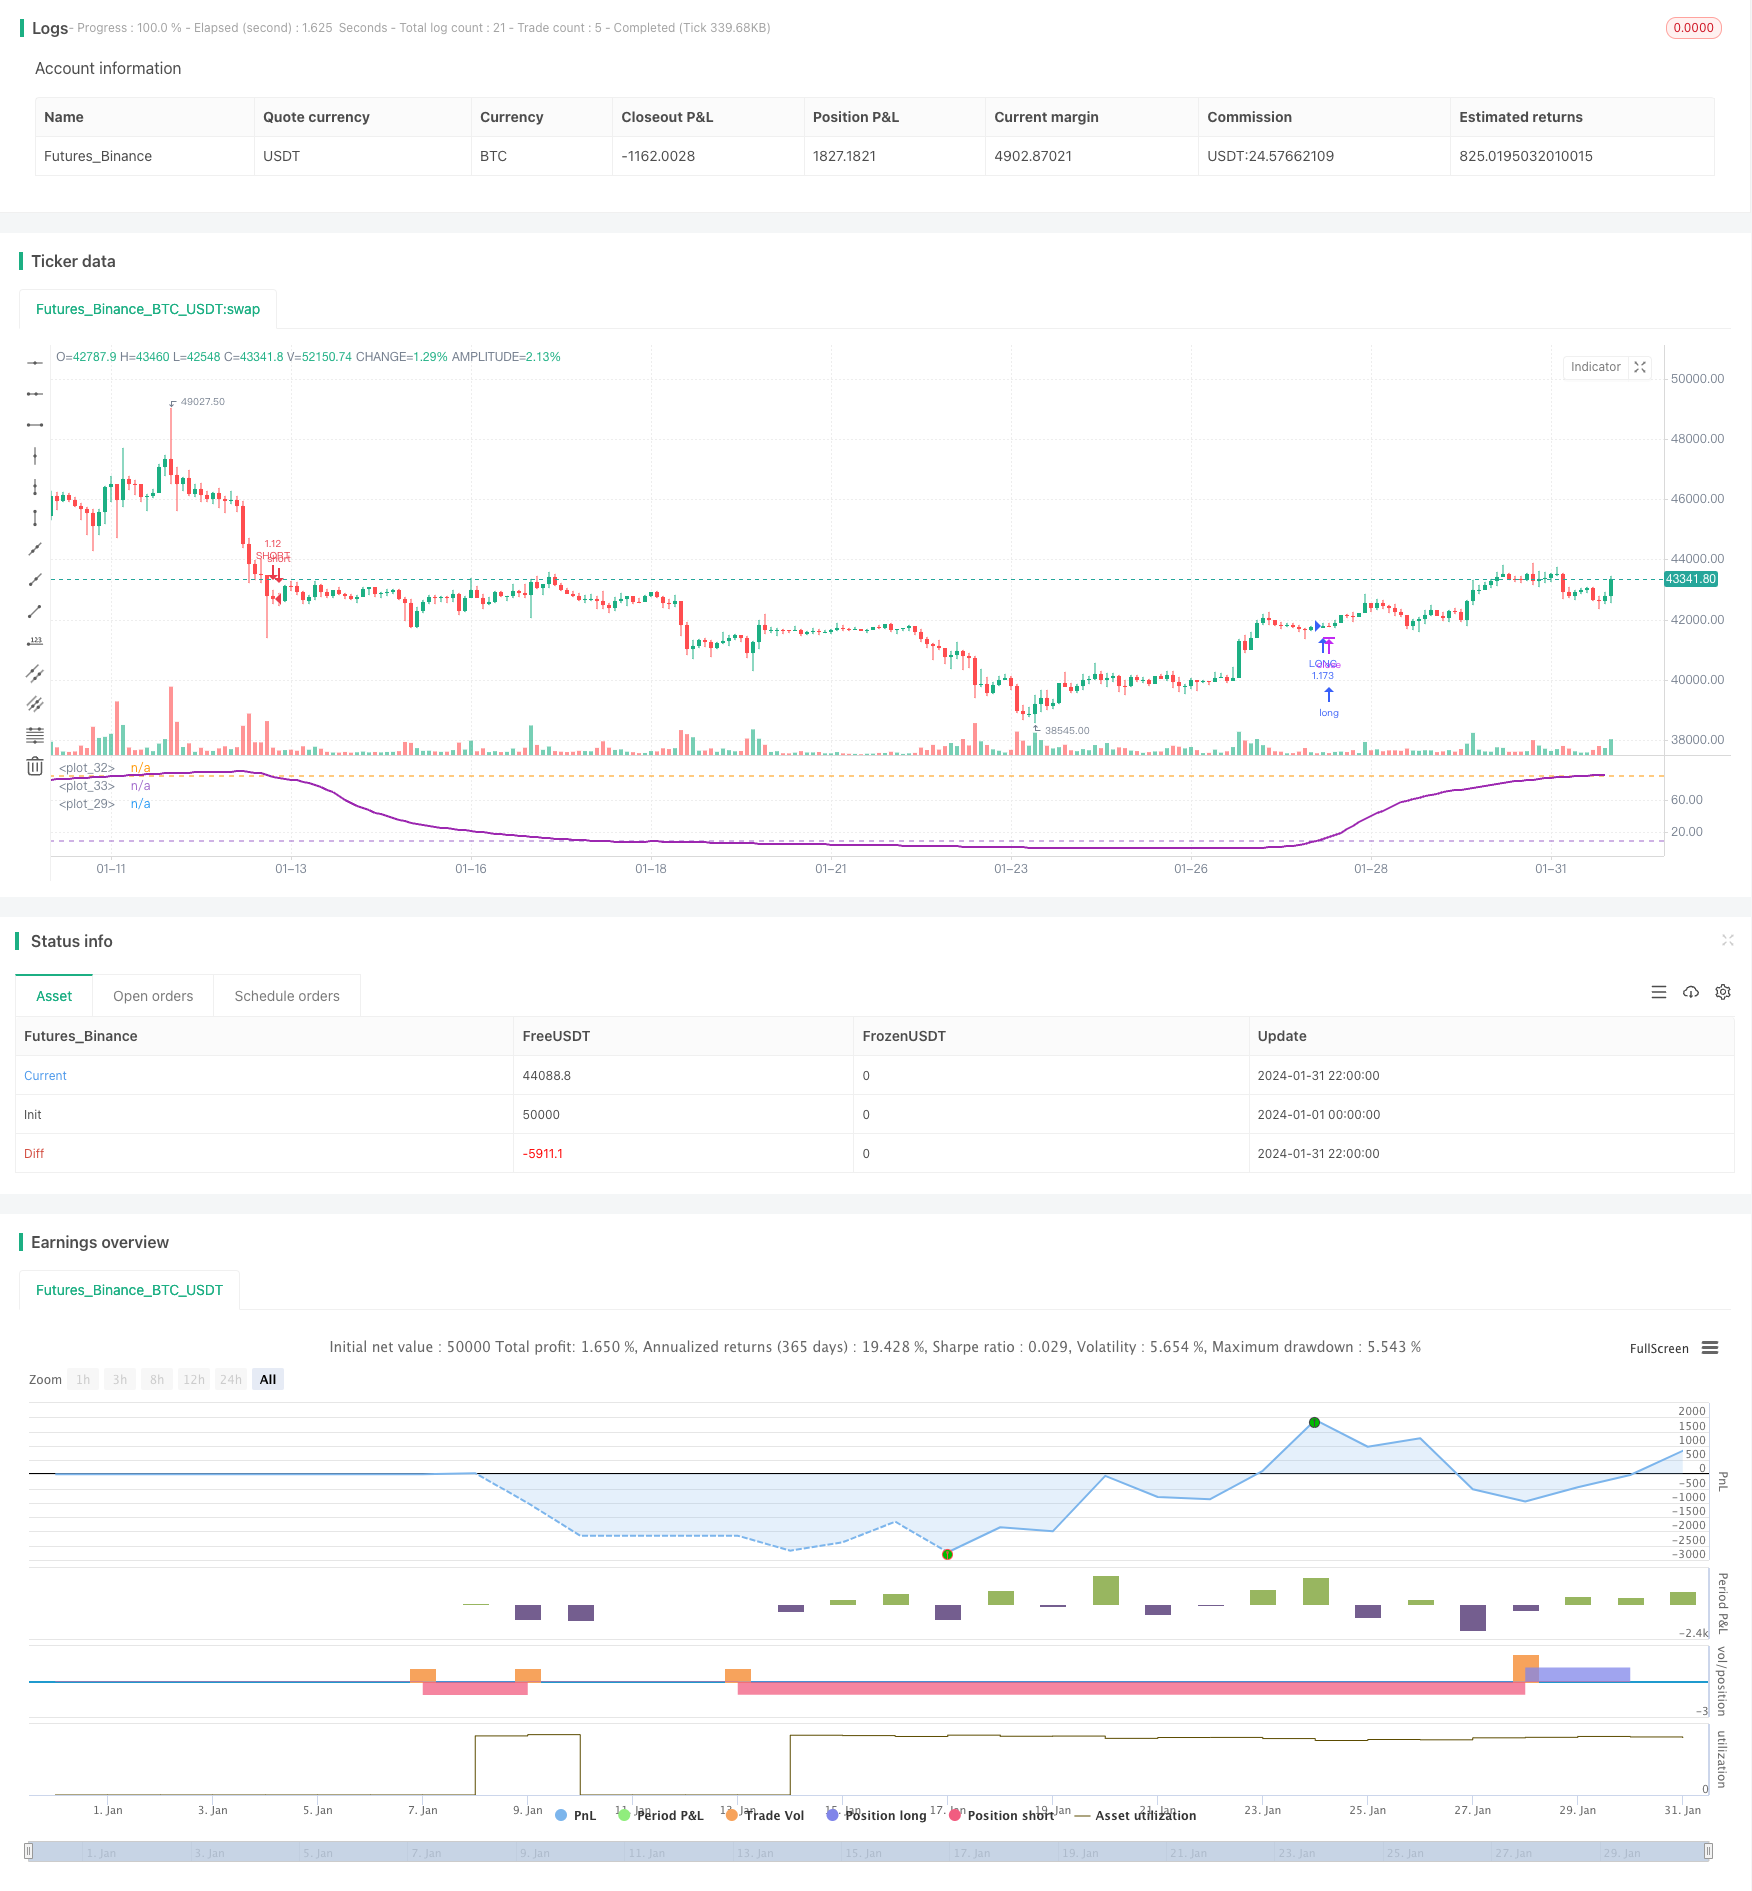
Overview
This strategy is an RSI oscillation tracking strategy based on annual adjustments. By tracking the oscillation characteristics of the RSI indicator between the set upper and lower bands, trading signals are issued when the RSI indicator touches the upper and lower bands.
Strategy Principle
- Set parameters for MA length, RSI, upper/lower band, take profit/stop loss, trading cycle range.
- Calculate RSI value, RSI = (Avg. Upward Change)/(Avg. Upward Change + Avg. Downward Change)*100
- Plot RSI line and bands
- RSI crossing below lower band is long signal, crossing above upper band is short signal
- Open position with OCO orders
- Execute stop loss and take profit based on settings
Advantage Analysis
- Setting annual trading cycle avoids unsuitable external environments.
- RSI reflects overbought/oversold efficiently. Reasonable range oscillation filters noise.
- OCO orders + stop loss/profit settings enable efficient risk control.
Risk Analysis
- Accuracy of RSI threshold judgement cannot be guaranteed, wrong judgements may happen.
- Improper annual cycle settings may miss better opportunities or enter unsuitable environments.
- Overlarge stop loss setting may lead to big losses, while too-small profit setting gives small profit.
Methods like adjusting RSI parameters, trading cycle range, stop loss/profit ratios can be used to optimize.
Optimization Directions
- Test optimal RSI parameters for different markets and cycles
- Analyze overall market cycle pattern, set best annual trading phase
- Determine reasonable stop loss/profit ratios through backtest
- Optimize trading products selection and position sizing
- Combine with other better techniques for further optimization
Summary
This strategy tracks trend by RSI’s annual cycle oscillation features, effectively controlling trading risks. Further performance improvement can be achieved by parameter tuning and logic optimization.
Strategy source code
/*backtest
start: 2024-01-01 00:00:00
end: 2024-01-31 23:59:59
period: 2h
basePeriod: 15m
exchanges: [{"eid":"Futures_Binance","currency":"BTC_USDT"}]
*/

//@version=3
strategy(title = "Bitlinc MARSI Study AST",shorttitle="Bitlinc MARSI Study AST",default_qty_type = strategy.percent_of_equity, default_qty_value = 100,commission_type=strategy.commission.percent,commission_value=0.1,initial_capital=1000,currency="USD",pyramiding=0, calc_on_order_fills=false)

// === General Inputs ===
lengthofma = input(62, minval=1, title="Length of MA")
len = input(31, minval=1, title="Length")
upperband = input(89, minval=1, title='Upper Band for RSI')
lowerband = input(10, minval=1, title="Lower Band for RSI")
takeprofit =input(1.25, title="Take Profit Percent")
stoploss =input(.04, title ="Stop Loss Percent")
monthfrom =input(8, title = "Month Start")
monthuntil =input(12, title = "Month End")
dayfrom=input(1, title= "Day Start")
dayuntil=input(31, title= "Day End")

// === Innput Backtest Range ===
//FromMonth = input(defval = 9, title = "From Month", minval = 1, maxval = 12)
//FromDay   = input(defval = 1, title = "From Day", minval = 1, maxval = 31)
//FromYear  = input(defval = 2018, title = "From Year", minval = 2017)
//ToMonth   = input(defval = 1, title = "To Month", minval = 1, maxval = 12)
//ToDay     = input(defval = 1, title = "To Day", minval = 1, maxval = 31)
//ToYear    = input(defval = 9999, title = "To Year", minval = 2017)

// === Create RSI ===
src=sma(close,lengthofma)
up = rma(max(change(src), 0), len)
down = rma(-min(change(src), 0), len)
rsi = down == 0 ? 100 : up == 0 ? 0 : 100 - (100 / (1 + up / down))
plot(rsi,linewidth = 2, color=purple)

// === Plot Bands ===
band1 = hline(upperband)
band0 = hline(lowerband)
fill(band1, band0, color=blue, transp=95)

// === Entry and Exit Methods ===
longCond =  crossover(rsi,lowerband)
shortCond =  crossunder(rsi,upperband)

// === Long Entry Logic ===
if (  longCond )
    strategy.entry("LONG", strategy.long, stop=close, oca_name="TREND", comment="LONG")
else
    strategy.cancel(id="LONG")

// === Short Entry Logic ===
if ( shortCond   )
    strategy.entry("SHORT", strategy.short,stop=close, oca_name="TREND",  comment="SHORT")
else
    strategy.cancel(id="SHORT")

// === Take Profit and Stop Loss Logic ===
//strategy.exit("Take Profit LONG", "LONG", profit = close * takeprofit / syminfo.mintick, loss = close * stoploss / syminfo.mintick)
//strategy.exit("Take Profit SHORT", "SHORT", profit = close * takeprofit / syminfo.mintick, loss = close * stoploss / syminfo.mintick)
strategy.exit("LONG TAKE PROFIT", "LONG", profit = close * takeprofit / syminfo.mintick)
strategy.exit("SHORT STOP LOSS", "SHORT", profit = close * takeprofit / syminfo.mintick)
strategy.exit("LONG STOP LOSS", "LONG", loss = close * stoploss / syminfo.mintick)
strategy.exit("SHORT STOP LOSS", "SHORT", loss = close * stoploss / syminfo.mintick)