Moving Average Crossover Trend Following Strategy
Author: ChaoZhang, Date: 2024-03-01 10:59:03Tags:

Overview
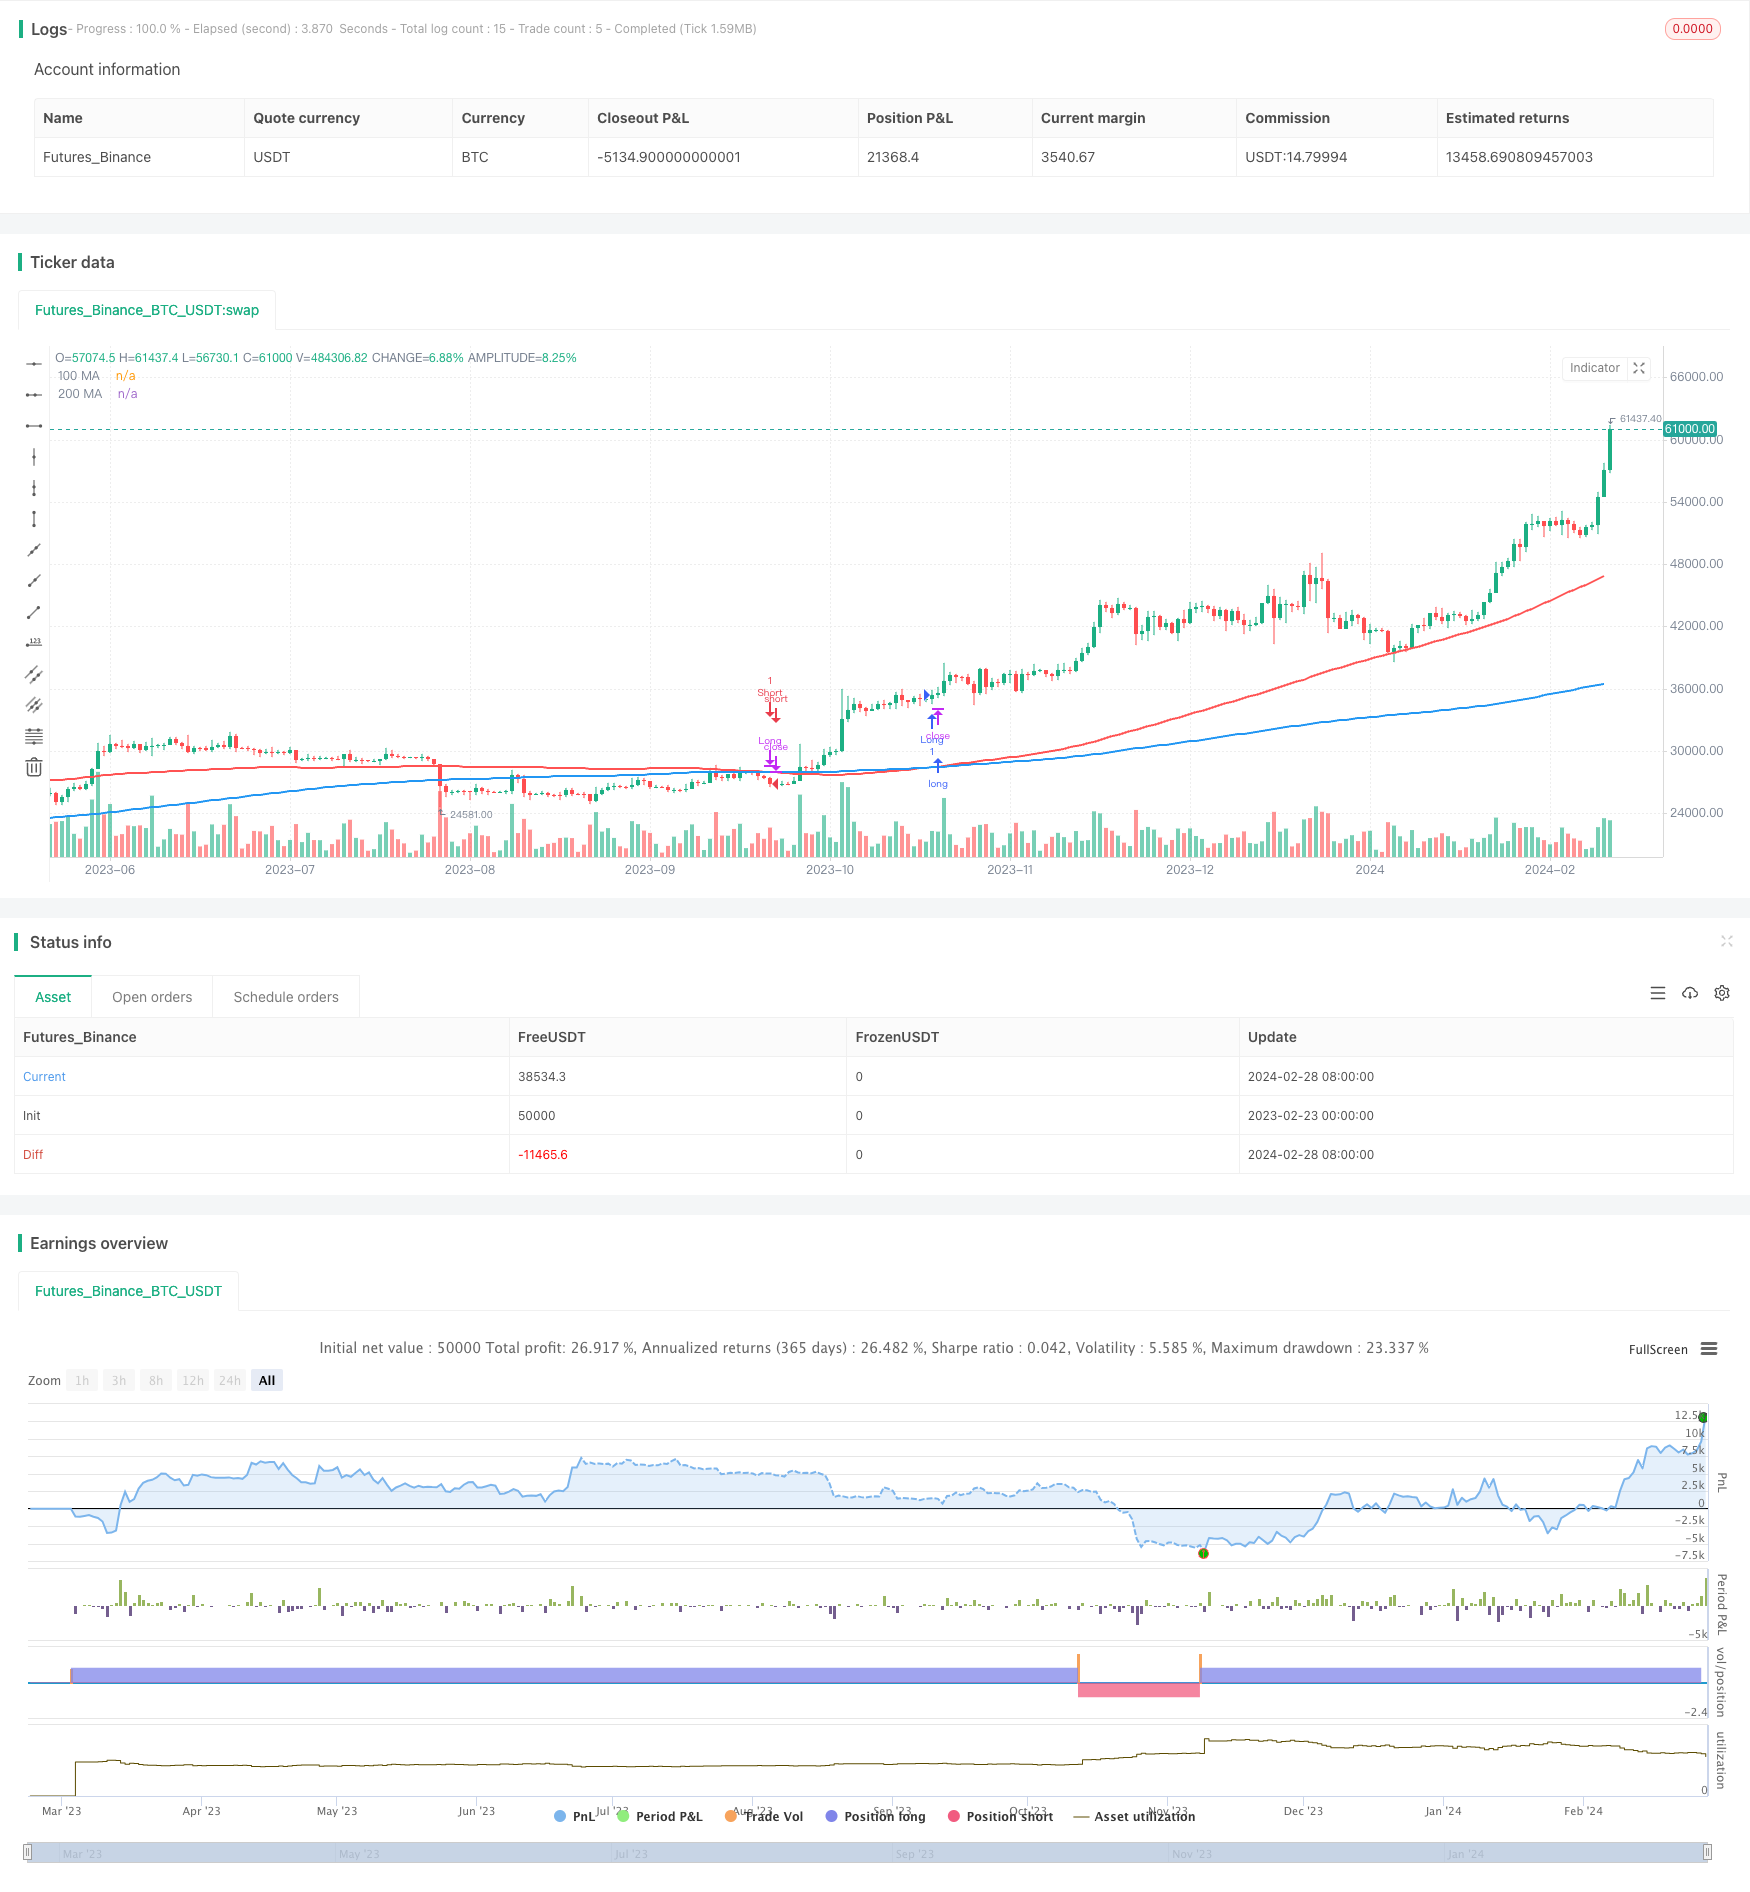
This strategy generates trading signals by calculating moving averages of different periods and using their crossover as buy and sell signals to follow the trend. The core logic is to use a shorter period moving average to track the turning points of a longer period trend.
Strategy Principle
- Calculate the 200-period and 100-period moving averages
- When the 100-period MA crosses above the 200-period MA, go long
- When the 100-period MA crosses below the 200-period MA, close long position
- When the 100-period MA crosses below the 200-period MA, go short
- When the 100-period MA crosses above the 200-period MA, close short position
The logic behind the trading signals is that the shorter period MA can respond to price changes faster and reflect the latest trend, while the longer period MA can better represent the overall trend and filter out noise. When the shorter MA crosses the longer MA, it indicates a trend reversal, so trading signals are triggered.
Advantage Analysis
- The strategy idea is simple and clear, easy to understand and implement
- Catching trend turning points through long and short period MA combination works well
- No need to predict specific price direction, just follow trend reversals, lower error rate
- Can optimize MA periods to adapt to different market environments
Risks and Solutions
- Too many false signals when trend fluctuates greatly. Solution is to adjust MA periods properly.
- Fail to respond fast on sudden reversals. Solution is to add confirming indicators like volume.
- Potentially too frequent trading, increasing costs. Solution is to adjust periods to lower frequency.
Optimization Directions
- Optimize MA period combinations to adapt more markets
- Add filters like volume and MACD to avoid false signals
- Add stop loss and take profit to control single trade risk
- Parameter combination optimization to find optimum
Summary
This strategy catches trend changes by simple MA crossovers. It belongs to typical trend following strategies. The pros are being simple, easy to use and adaptable by parameter tuning. The cons are slow reaction and false signals. Overall it has a clear logic and is a good starting point for algo trading. Proper risk management and optimization are needed for live trading.
/*backtest
start: 2023-02-23 00:00:00
end: 2024-02-29 00:00:00
period: 1d
basePeriod: 1h
exchanges: [{"eid":"Futures_Binance","currency":"BTC_USDT"}]
*/

//@version=5
strategy("MA Crossover Strategy", overlay=true)

// Функция для получения скользящего среднего на заданном таймфрейме
getMA(source, length, timeframe) =>
    request.security(syminfo.tickerid, timeframe, ta.sma(source, length))

// Вычисляем 200-периодное и 100-периодное скользящее среднее для текущего таймфрейма
ma200 = getMA(close, 200, "240")
ma100 = getMA(close, 100, "240")

// Открываем позицию Long, если 100-периодное скользящее среднее пересекает 200-периодное сверху вниз
if (ta.crossover(ma100, ma200))
    strategy.entry("Long", strategy.long)

// Закрываем позицию Long, если 100-периодное скользящее среднее пересекает 200-периодное сверху вниз
if (ta.crossunder(ma100, ma200))
    strategy.close("Long")

// Открываем позицию Short, если 100-периодное скользящее среднее пересекает 200-периодное сверху вниз
if (ta.crossunder(ma100, ma200))
    strategy.entry("Short", strategy.short)

// Закрываем позицию Short, если 100-периодное скользящее среднее пересекает 200-периодное снизу вверх
if (ta.crossover(ma100, ma200))
    strategy.close("Short")

// Рисуем линии скользящих средних на графике
plot(ma200, color=color.blue, linewidth=2, title="200 MA")
plot(ma100, color=color.red, linewidth=2, title="100 MA")
- Gold Trading with Simons Strategy
- MACD, RSI and EMA Strategy
- Trend Following Moving Average Strategy
- Quant Trading Strategy Based on HullMA Percentage Bands
- RSI and smoothed RSI bullish divergence strategy
- Dual-directional Trailing Stop Moving Average Trend Strategy
- The Breakout Regression Strategy
- Fast RSI Reversal Trading Strategy
- The Momentum Burst Tracking Strategy
- Elevated Touch Short Triangle Strategy
- Double Confirmation Breakthrough Strategy
- Walnut Trend Following Strategy Based on Distance from 200 EMA
- VWAP Trend Following Strategy
- Turtle Trend Strategy
- Market Reversal Momentum Strategy
- Triple BB Bands Breakout with RSI Strategy
- Dual Moving Average Channel Trading Strategy
- Adaptive Channel Breakout Strategy
- An Advanced EMA Trend Following Strategy with Relaxed RSI and ATR Filters
- Triple Confirmation Trend Tracking Strategy