El valor de las emisiones de gases de efecto invernadero
El autor:¿ Qué pasa?, Fecha: 2022-05-18 15:32:51Las etiquetas:El EMA
***Este no es un consejo comercial - NO hay garantías - USE A SU PROPIO RISCO***
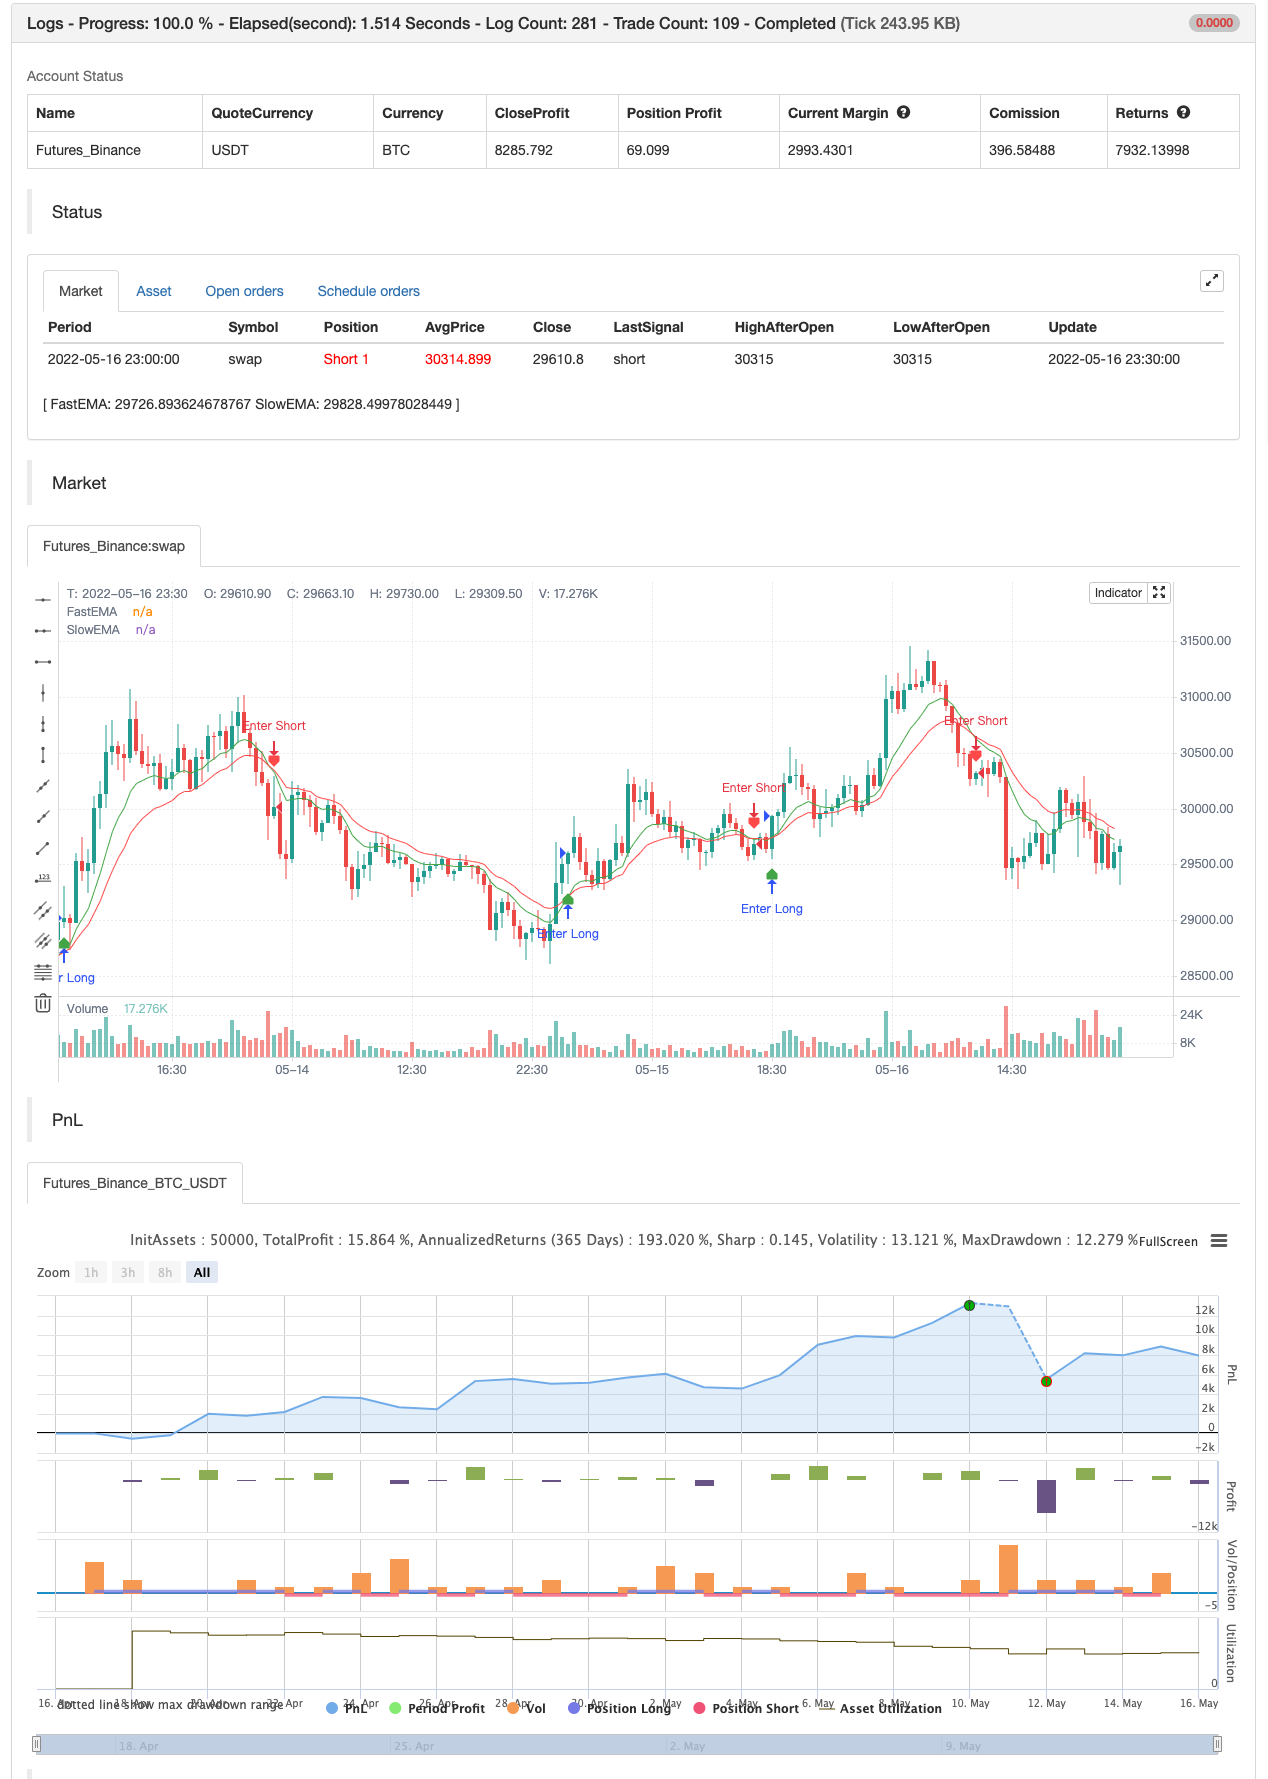
Traza los promedios móviles exponenciales (EMA) de los períodos 9 y 20 y pinta una nube entre ellos, identificando visualmente la tendencia intradiaria y la fuerza de la misma. Nube verde para largo, nube roja para corto. Cuanto más gruesa sea la nube, más fuerte será la tendencia. La entrada de juego largo es cuando la EMA de 9 cruza por encima de la EMA de 20 haciendo que la nube se vuelva verde, opuesta para corto.
La entrada agresiva es cuando la segunda barra después de la cruz se cierra por encima de la 9 EMA y está en la dirección de la jugada.
Las salidas pueden ocurrir cuando el precio se cierra en la nube o en el lado opuesto de la nube o cuando los promedios se cruzan en la dirección opuesta del comercio dependiendo de la tolerancia al riesgo del individuo.
***Este no es un consejo comercial - NO hay garantías - USE A SU PROPIO RISCO***
Prueba posterior

/*backtest
start: 2022-04-17 00:00:00
end: 2022-05-16 23:59:00
period: 30m
basePeriod: 15m
exchanges: [{"eid":"Futures_Binance","currency":"BTC_USDT"}]
args: [["v_input_1",10],["v_input_2",18]]
*/

// This source code is subject to the terms of the Mozilla Public License 2.0 at https://mozilla.org/MPL/2.0/
// © Ron Westbrook (discord: disturbinglymellow#4075)
// Date: 5/17/2021
// Description: Plots two exponential moving averages and places a colored cloud between to indicate trend direction. Default values of 9 and 20 periods have worked well for me, but inputs are available if you choose to change them. If you like my work and want to support more of it please consider leaving me a tip here. https://tinyurl.com/tipron


//@version=5
indicator(title='EMA TREND CLOUD', overlay=true)

fastLen = input(title='Fast EMA Length', defval=9)
slowLen = input(title='Slow EMA Length', defval=20)
useTextLabels = input.bool(true, title='Use Text-Based Crossover Labels?', group='Crossover Moving Averages')

fastEMA = ta.ema(close, fastLen)
slowEMA = ta.ema(close, slowLen)

fema = plot(fastEMA, title='FastEMA', color=color.new(color.green, 0), linewidth=1, style=plot.style_line)
sema = plot(slowEMA, title='SlowEMA', color=color.new(color.red, 0), linewidth=1, style=plot.style_line)

fill(fema, sema, color=fastEMA > slowEMA ? color.new(#417505, 50) : color.new(#890101, 50), title='Cloud')

// Bull and Bear Alerts
Bull = ta.crossover(fastEMA, slowEMA)
Bear = ta.crossunder(fastEMA, slowEMA)

plotshape(Bull, title='Calls Label', color=color.new(color.green, 25), textcolor=useTextLabels ? color.white : color.new(color.white, 100), style=useTextLabels ? shape.labelup : shape.triangleup, text='Calls', location=location.belowbar)

plotshape(Bear, title='Puts Label', color=color.new(color.red, 25), textcolor=useTextLabels ? color.white : color.new(color.white, 100), style=useTextLabels ? shape.labeldown : shape.triangledown, text='Puts', location=location.abovebar)


if Bull
    alert('Calls Alert: 9ema crossed over 20ema', alert.freq_once_per_bar_close)
if Bear
    alert('Puts Alert: 9ema crossed under 20ema', alert.freq_once_per_bar_close)


if Bull
    strategy.entry("Enter Long", strategy.long)
else if Bear
    strategy.entry("Enter Short", strategy.short)
- El juicio de tendencias multidimensionales y la estrategia de stop loss dinámico de ATR
- Las tendencias de alto nivel de múltiples indicadores confirman la estrategia de negociación
- Estrategias de seguimiento de tendencias de adaptación y confirmación múltiple
- Estrategias de optimización de operaciones diarias combinadas con indicadores de movimiento RSI
- Estrategias de seguimiento de tendencias de movilidad entre múltiples indicadores tecnológicos
- La tendencia de la EMA combinada con el cambio de posición para romper la estrategia de negociación
- Estrategias de negociación cuantificadas de parámetros dinámicos de RSI con ayuda de líneas multicruzadas
- Las tendencias dinámicas determinan la estrategia de cruce del indicador RSI
- Estrategias de seguimiento de tendencias dobles: el índice es uniforme con el MACD
- Tendencias multidimensionales de múltiples indicadores y estrategias avanzadas de cuantificación
- Múltiples estrategias de transacción de seguimiento de tendencias cruzadas dinámicas de línea media lisa con múltiples confirmaciones
- ATR suavizado
- Buscador de bloques de orden
- TendenciaScalp-FractalBox-3EMA
- Señales de QQE
- Selección de amplitud de red en U
- Indicador personalizado CM MACD - Marco de tiempo múltiple - V2
- Línea de captura
- 2 Detección de la dirección del color de la media móvil
- El valor de las pérdidas de crédito se calculará en función de las pérdidas de crédito.
- La estrategia de compra y venta depende de AO+Stoch+RSI+ATR
- Ratio de energía direccional acelerada por volumen de RedK
- Donchian Breakout sin repintura
- Barras de impulso de RedK
- Super Salto Volver hacia atrás Banda de Bollinger
- Tendencia de Fukuiz
- El BOT de Johnny
- SSL híbrido
- Salida de la lámpara
- El RISOTTO
- Estrategia intradiaria de la nube de la EMA
¿Qué es eso?No entiendo el inglés.