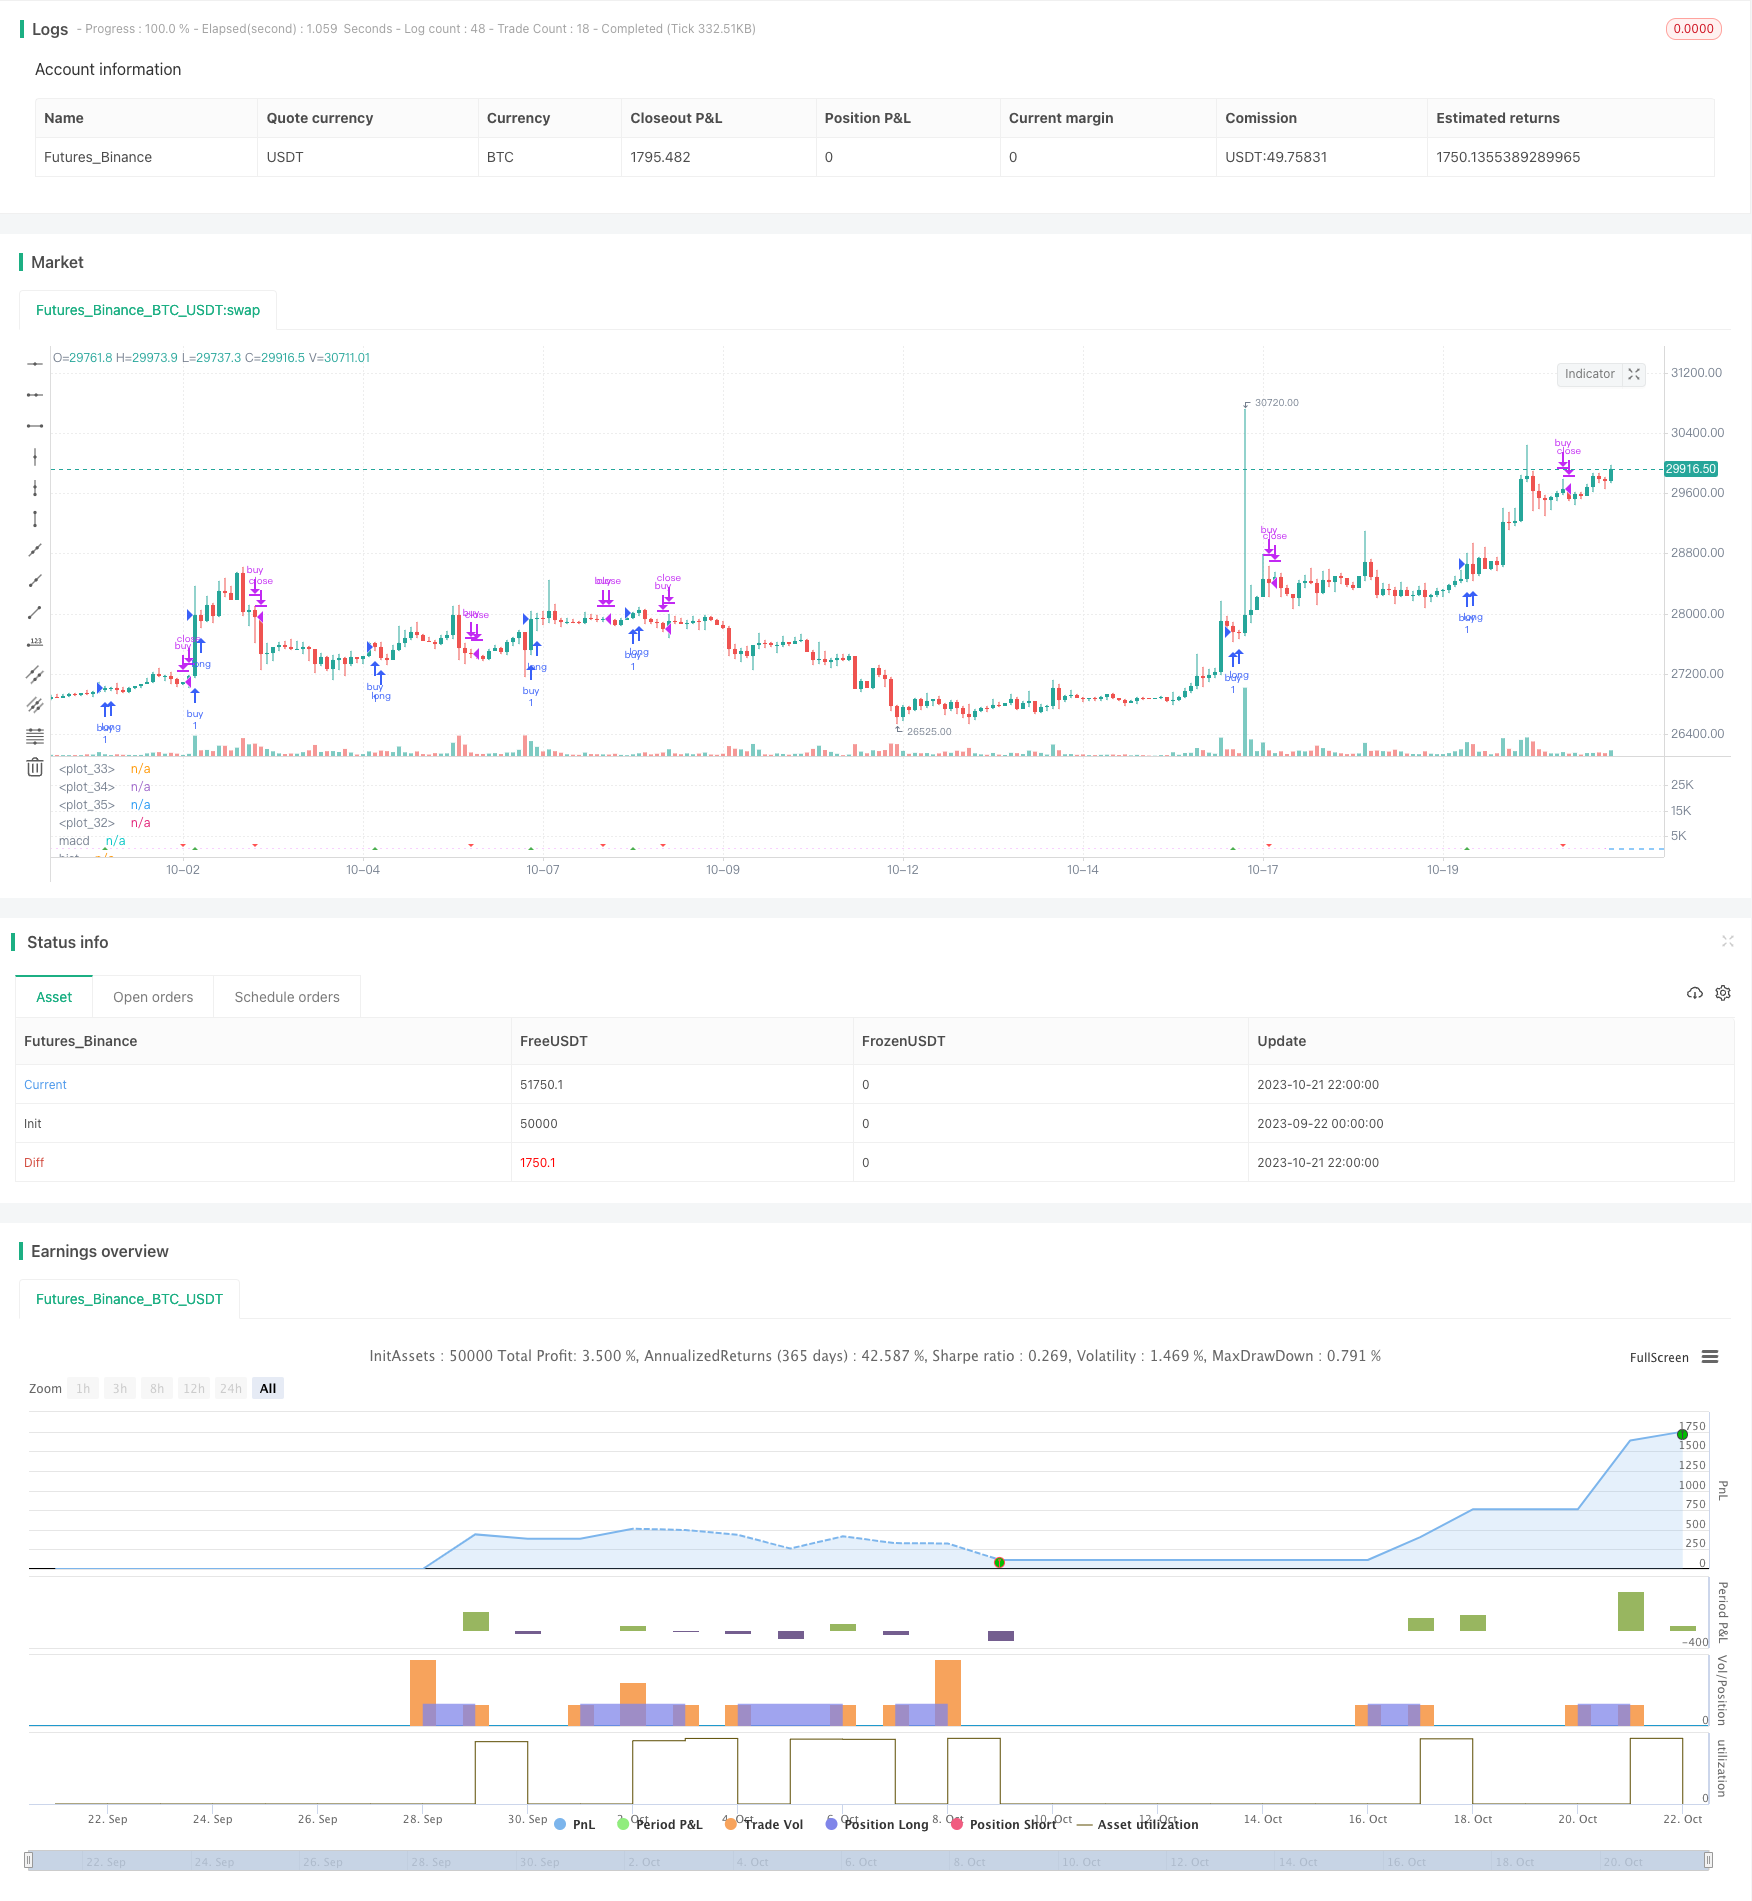
RSI MACD Crossover Estrategia de seguimiento de doble MA
El autor:¿ Qué pasa?, Fecha: 2023-10-23 17:00:44Las etiquetas:

Resumen general
Esta estrategia combina el indicador RSI, el indicador MACD y las medias móviles dobles para lograr efectos de seguimiento de tendencias y posicionamiento en el mercado de volatilidad.
Estrategia lógica
- Calcular el indicador RSI de sobrecompra y sobreventa
-
Calcular el cambio de precio tendencia alcista y tendencia bajista
-
Calcular el RSI basado en la variación de precios
-
Determinar los niveles de sobrecompra y sobreventa
- Calcular el MACD para el cruce
-
Calcular el MA rápido, el MA lento y la línea de señal
-
Entra por la cruz dorada y sale por la cruz de la muerte.
-
Trazar las situaciones de cruce
- Implementar un filtro doble de MA
-
Calcular las medias móviles rápidas y lentas
-
Solo se considerará la negociación cuando el MA rápido cruce el MA lento
-
Filtra el ruido y sigue la tendencia
- Indicadores combinados para la entrada
-
Se trata de un sistema de control de los flujos de caja.
-
Mejorar la exactitud y la estabilidad de la estrategia
Análisis de ventajas
-
La combinación de múltiples indicadores mejora la precisión
-
La tendencia siguiente filtra el ruido y mejora la estabilidad
-
El RSI detecta puntos de reversión potenciales
-
El cruce MACD proporciona señales de entrada y salida simples
-
El doble MA elimina la mayoría de las operaciones de contratrend
-
Fácil de entender con pocos parámetros, bueno para aprender
Análisis de riesgos
-
Riesgo de sobreajuste con múltiples indicadores
-
El doble MA sacrifica la flexibilidad y puede perder oportunidades
-
Los parámetros RSI y MACD requieren una selección cuidadosa
-
Preste atención al stop loss basado en el símbolo
-
Requiere un reajuste periódico de los parámetros
Direcciones de optimización
-
Ajustar los parámetros del RSI para diferentes símbolos
-
Optimizar los períodos de doble admisión para un mejor seguimiento
-
Añadir stop loss para controlar la pérdida de una sola operación
-
Incorporar más indicadores para enriquecer el combo
-
Desarrollar un modelo adaptativo de parámetros para el ajuste automático
Resumen de las actividades
Esta estrategia combina RSI, MACD y doble MA para identificar y rastrear tendencias, y filtra las señales a través de múltiples capas. Es muy adecuado para que los principiantes aprendan y mejoren. La ventaja radica en su simplicidad y adaptabilidad.
/*backtest
start: 2023-09-22 00:00:00
end: 2023-10-22 00:00:00
period: 2h
basePeriod: 15m
exchanges: [{"eid":"Futures_Binance","currency":"BTC_USDT"}]
*/

//@version=3

// strategy(title="RSI MACD", precision = 6, pyramiding = 1, default_qty_type = strategy.percent_of_equity, default_qty_value = 99, commission_type = strategy.commission.percent, commission_value = 0.25, initial_capital = 1000)

// Component Code Start
// Example usage:
// if testPeriod()
//   strategy.entry("LE", strategy.long)
testStartYear = input(2017, "Backtest Start Year")
testStartMonth = input(01, "Backtest Start Month")
testStartDay = input(2, "Backtest Start Day")
testPeriodStart = timestamp(testStartYear,testStartMonth,testStartDay,0,0)

testStopYear = input(2019, "Backtest Stop Year")
testStopMonth = input(7, "Backtest Stop Month")
testStopDay = input(30, "Backtest Stop Day")
testPeriodStop = timestamp(testStopYear,testStopMonth,testStopDay,0,0)

// A switch to control background coloring of the test period
testPeriodBackground = input(title="Color Background?", type=bool, defval=true)
testPeriodBackgroundColor = testPeriodBackground and (time >= testPeriodStart) and (time <= testPeriodStop) ? #00FF00 : na
bgcolor(testPeriodBackgroundColor, transp=97)

testPeriod() => true
// Component Code Stop

//standard rsi template
src = ohlc4, len = input(14, minval=1, title="Length")
up = rma(max(change(src), 0), len)
down = rma(-min(change(src), 0), len)
rsi = down == 0 ? 100 : up == 0 ? 0 : 100 - (100 / (1 + up / down))
plot(rsi, color=#87ff1a)
band1 = hline(80)
band = hline(50)
band0 = hline(20)
fill(band1, band0, color=purple, transp=90)

//macd

fast_length = input(title="Fast Length",  defval=9)
slow_length = input(title="Slow Length",  defval=72)
signal_length = input(title="Signal Length",  defval=9)

fast_ma = sma(rsi, fast_length)
slow_ma = sma(rsi, slow_length)
shortma = sma(ohlc4, fast_length)
longma = sma(ohlc4, slow_length)
controlmainput = input(title = "Control MA", defval = 234)
controlma = sma(ohlc4, controlmainput)
macdx = fast_ma - slow_ma
signalx = sma(macdx, signal_length)
hist = macdx - signalx
ma_hist = shortma - controlma
macd = macdx + 50
signal = signalx + 50

plot(macd,"macd", color = fuchsia)
plot(hist,"hist", style = histogram, color = fuchsia)
//plot(ma_hist,"ma hist", style = histogram, color = orange)
plot(signal,"signal", color = white)

//input
control_buy_toggle = input(true, "Buy on crossover control MA?", type = bool)
buy_on_control = control_buy_toggle == true? true : false

//conditions
buy = buy_on_control == true? ma_hist > 0 and shortma > longma and crossover(macd,signal) or crossover(shortma, controlma) : ma_hist > 0 and shortma > longma and crossover(macd,signal)
sell = ma_hist > 0 and shortma > longma and crossunder(macd,signal)
stop = crossunder(shortma, longma) or crossunder(shortma, controlma)

plotshape(buy,"buy", shape.triangleup, location.bottom, green, size = size.tiny)
plotshape(sell,"sell", shape.triangledown, location.bottom, red, size = size.tiny)
plotshape(stop,"stop",shape.circle,location.bottom, white, size = size.tiny)

if testPeriod()
    strategy.entry("buy", true, when = buy, limit = close)
    strategy.close("buy", when = sell)
    strategy.close("buy", when = stop)
- Estrategia para el avance rápido de los índices de rentabilidad
- Estrategia de seguimiento de la media móvil para detener pérdidas
- Estrategia de negociación cuantitativa de múltiples factores
- Tendencia siguiendo una estrategia basada en el cruce de la media móvil
- Estrategia de canal de precios de Noro v1.1
- Estrategia de inversión de la media móvil doble
- Estrategia de negociación de oscilación de patrón triple
- Sistema de reversión de tendencia
- Estrategia SMA de ruptura del canal
- Estrategia de reversión de tendencia del RSI
- Estrategia de tendencia de marcos de tiempo múltiples
- La estrategia de inversión de la media de la RSI doble
- Heikin Ashi ROC Estrategia de negociación en porcentaje
- Estrategia de ruptura de tendencia basada en la desviación de la media móvil
- Estrategia de retroceso de la media móvil contra la tendencia
- Tendencia de promedio móvil siguiendo la estrategia Golden Cross Long
- Estrategia de ruptura de impulso
- Estrategia de la unidad abierta
- Estrategia combinada de inversión de impulso
- Master Crossover - Estrategia de ruptura de inversión