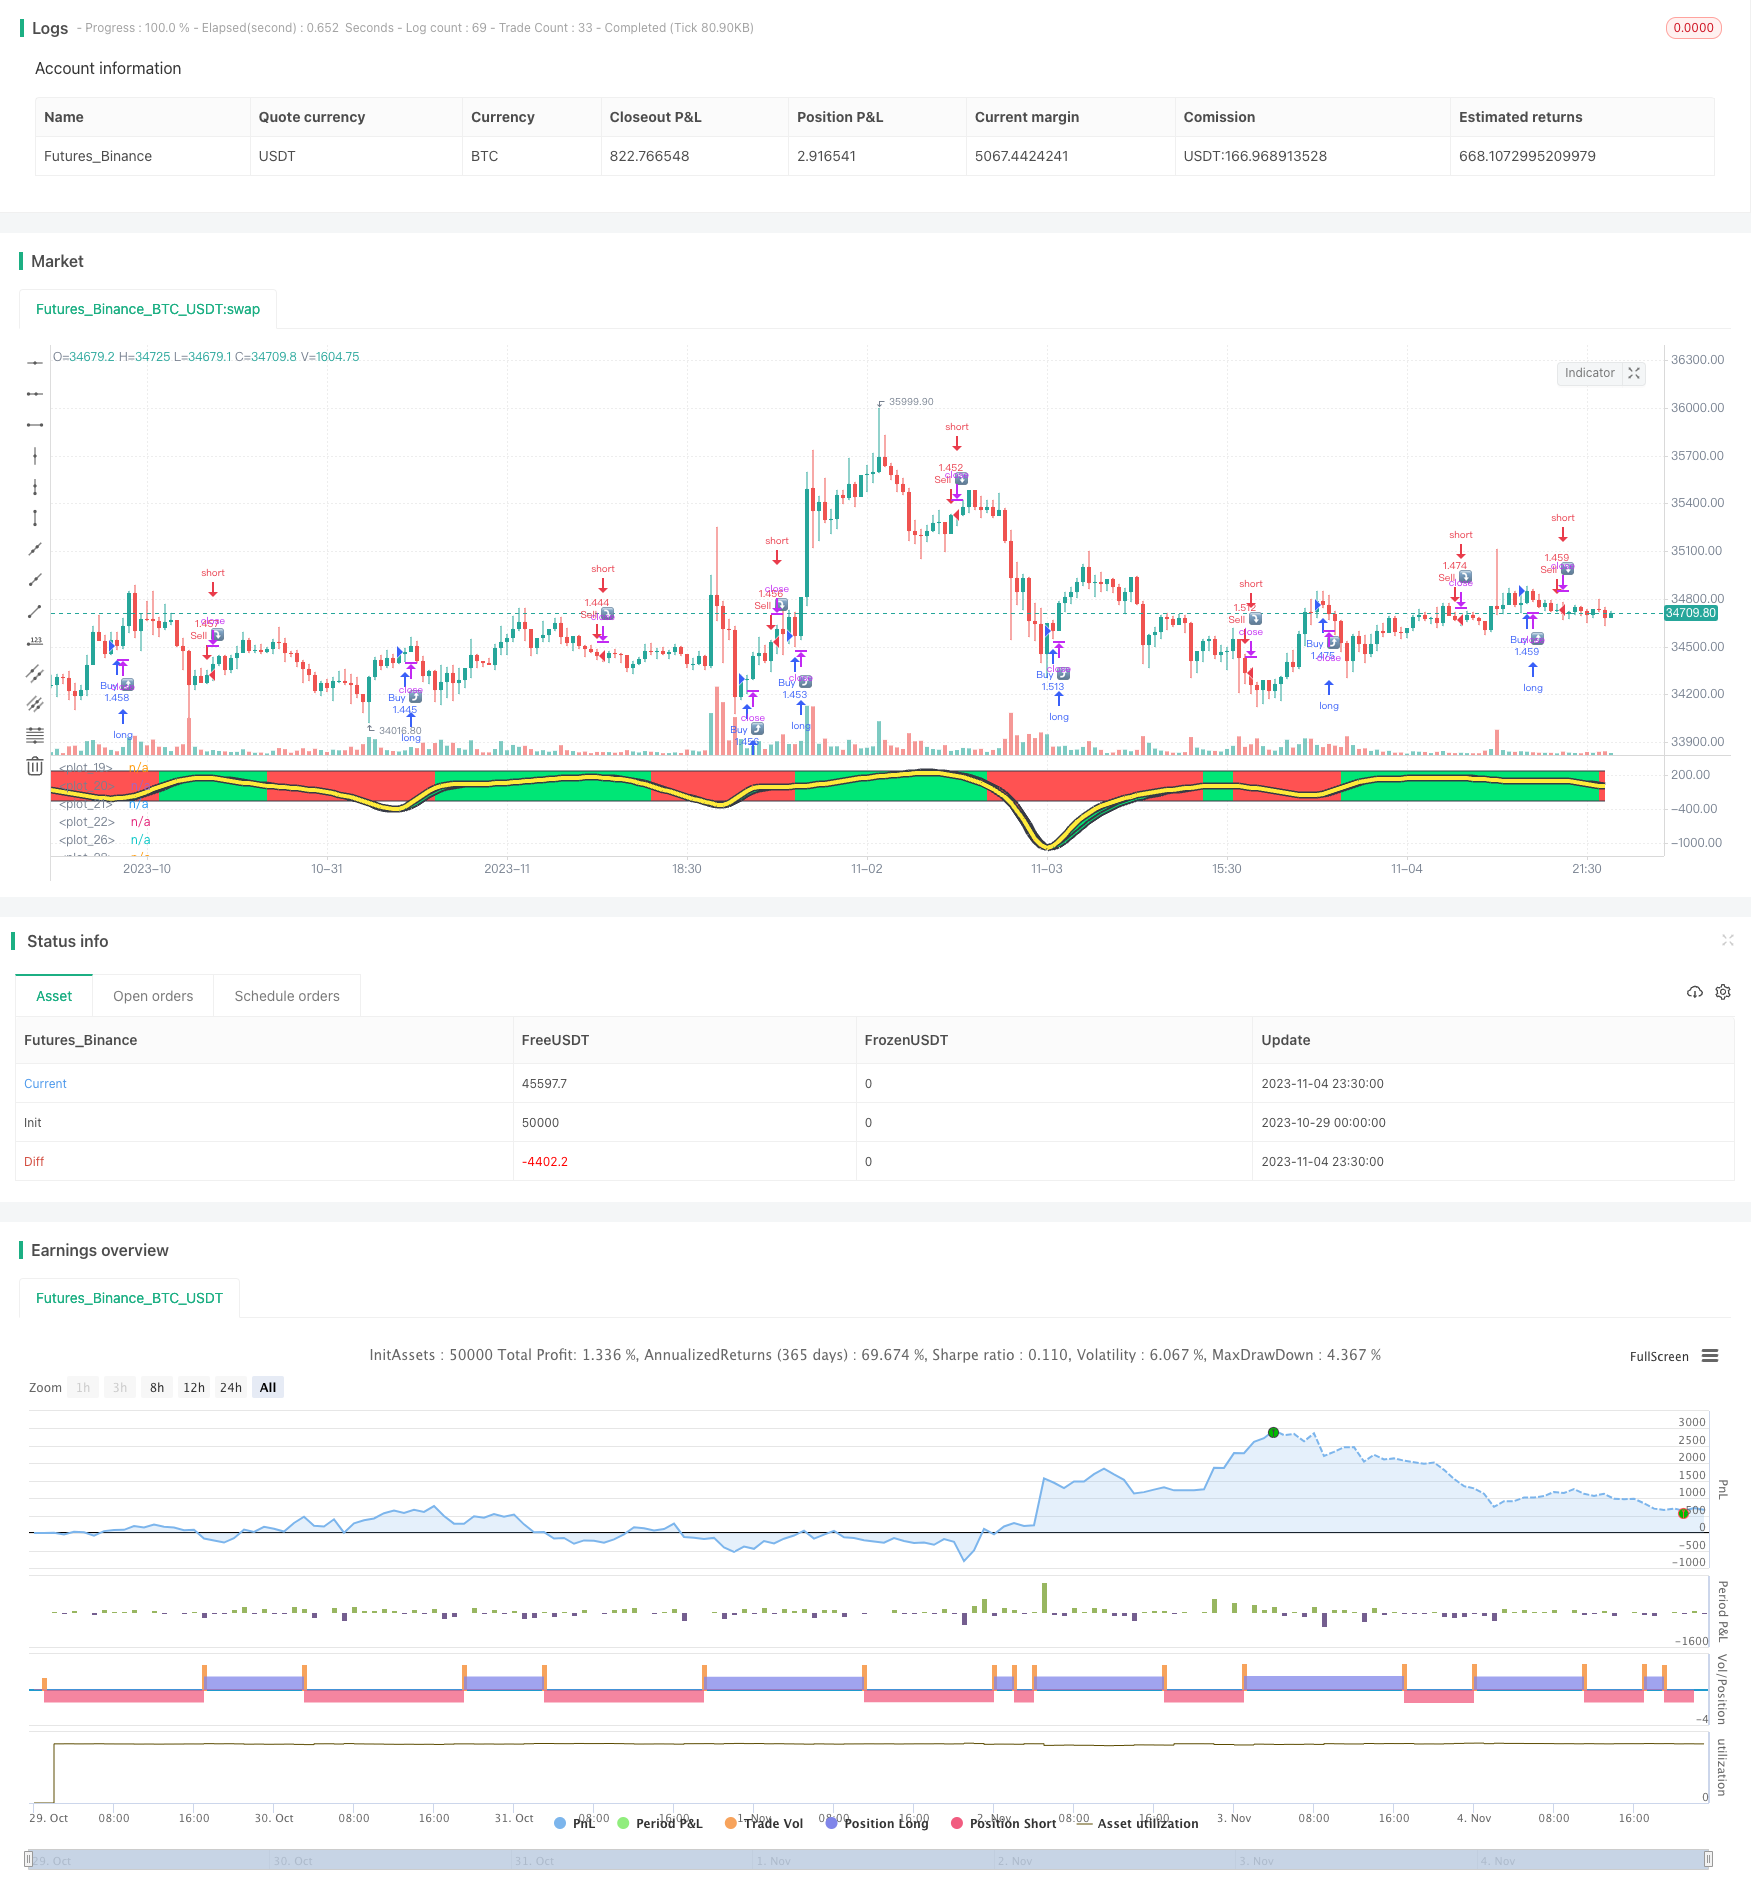
Indicador de desviación de tendencia K-line combinado con estrategia de onda de media móvil

Descripción general
Esta estrategia calcula la desviación de la tendencia de los precios del TSI y luego realiza un tratamiento de promedio móvil del TSI para formar el promedio móvil del TSI. La dirección de la línea K combinada con los precios determina si el precio de las acciones está actualmente en una tendencia alcista o descendente, lo que genera una señal de compra y venta.
El principio
La estrategia se divide en los siguientes pasos:
- Cálculo del cambio de precio pct
- El pct es suavizado con doble HMA y se obtiene double_smoothed_pc
- Calcula el doble HMA del valor absoluto de pct, obteniendo double_smoothed_abs_pc
- Calcula el valor del TSI:*(double_smoothed_pc / double_smoothed_abs_pc))
- El promedio móvil de HMA de los valores del TSI es el promedio móvil de tsihmaline del TSI
- Comparación de la relación entre el valor del TSI y el promedio móvil del TSI, con tendencia ascendente cuando el TSI es superior al promedio móvil y con tendencia descendente cuando el TSI es inferior al promedio móvil
- En una tendencia ascendente, si el precio también está subiendo, se genera una señal de compra
- Cuando hay una tendencia bajista, se genera una señal de venta si el precio también baja.
A través de los pasos anteriores, se puede determinar la dirección de la tendencia general actual, combinada con el movimiento real de los precios, para generar una señal de negociación.
Las ventajas
- Dual HMA para filtrar eficazmente el ruido de corta duración y bloquear las tendencias principales
- El TSI, junto con sus medias móviles, puede determinar la dirección de la tendencia general
- Combinación de la dirección de la línea K del precio para evitar falsas rupturas y mejorar la fiabilidad de la señal
- Los parámetros son ajustables, los parámetros de suavizado se pueden ajustar según el mercado para adaptarse a diferentes ciclos
- El gráfico es intuitivo, el verde es la tendencia al alza y el rojo es la tendencia a la baja.
El riesgo
- Cuando ocurren temblores, se producen varias señales erróneas
- Los promedios móviles se quedan atrás en los puntos de cambio de tendencia y pueden perderse los mejores puntos de entrada.
- Necesidad de ajustar los parámetros con frecuencia para adaptarse a los cambios en el mercado
- Esta estrategia se basa en un solo indicador TSI y puede optimizarse en combinación con otros indicadores
Dirección de optimización
- Se pueden añadir filtros para evitar señales erróneas en la ciudad de temblor
- Se pueden agregar otros indicadores para determinar puntos de inflexión de tendencia.
- Los parámetros se pueden optimizar automáticamente mediante métodos como el aprendizaje automático.
- Se pueden introducir estrategias de stop loss para controlar las pérdidas individuales.
Resumir
Esta estrategia utiliza el indicador TSI para determinar la dirección de la tendencia y, en combinación con la línea K del precio, genera una señal de negociación que permite capturar la tendencia de manera efectiva, comprar en la tendencia alcista y vender en la tendencia descendente. Sin embargo, también existe un cierto riesgo que debe optimizarse para mejorar la estabilidad. En general, la estrategia es intuitiva y fácil de entender y es adecuada para los operadores familiarizados con los indicadores técnicos.
/*backtest
start: 2023-10-29 00:00:00
end: 2023-11-05 00:00:00
period: 30m
basePeriod: 15m
exchanges: [{"eid":"Futures_Binance","currency":"BTC_USDT"}]
*/

//@version=4
strategy(title="TSIHULLBOT", shorttitle="TSICCIHULL", default_qty_type=strategy.percent_of_equity, default_qty_value=100)
long = input(title="Long Length", type=input.integer, defval=50)
short = input(title="Short Length", type=input.integer, defval=50)
signal = input(title="Signal Length", type=input.integer, defval=7)
price = input(title="Source",type=input.source,defval=open)
lineupper = input(title="Upper Line", type=input.integer, defval=250)
linelower = input(title="Lower Line", type=input.integer, defval=-250)
double_smooth(price, long, short) =>
    fist_smooth = hma(price, long)
    hma(fist_smooth, short)
pc = change(price)
double_smoothed_pc = double_smooth(pc, long, short)
double_smoothed_abs_pc = double_smooth(abs(pc), long, short)
tsi_value = (100 * (double_smoothed_pc / double_smoothed_abs_pc))*5
tsihmaline=(hma(tsi_value,signal))*5
clr = tsihmaline < tsi_value ? color.red : color.lime
clr2 = tsi_value < tsi_value[1] ? color.red : color.lime
i1=plot(lineupper+3, color=color.black, linewidth=3)
i2=plot(linelower+3, color=color.black, linewidth=3)
i3=plot(lineupper, color=clr)
i4=plot(linelower, color=clr)
trendv=tsihmaline/5.6
plot(trendv, linewidth=7,  color=color.black)
plot(trendv, linewidth=4,  color=color.yellow)
j1=plot(tsi_value, linewidth=5, color=color.black)
j2=plot(tsi_value[1], linewidth=5, color=color.black)
j3=plot(tsi_value, color=clr2)
j4=plot(tsi_value[1], color=clr2)
fill(i3,i4,color=clr,transp=90)
fill(j3,j4,color=clr2,transp=15)
longCondition = tsihmaline>tsihmaline[1] and price>price[1]
if (longCondition)
    strategy.entry("Buy ⤴️", strategy.long)
shortCondition = tsihmaline<tsihmaline[1] and price<price[1]
if (shortCondition)
    strategy.entry("Sell ⤵️", strategy.short)