概述
该策略运用布林线指标判断价格的波动幅度,结合K线形态进行价格突破操作。布林线的上下轨可以大致判断价格的上升和下降趋势,将其与K线形态指标相结合,可以找出比较明显的买卖时机。该策略主要判断布林线下轨突破做多,上轨突破做空,同时结合Stoch指标判断超买超卖状态,利用K线形态提供备选买卖信号。
策略原理
该策略主要由以下几部分指标组成:
布林线指标,包括布林线中轨、上轨、下轨。布林线通过价格的标准差计算出价格的波动范围, 从而判断价格的波动趋势。
Stoch指标,判断股票是否处于超买超卖状态。K线和D线可以判断是否向上突破和向下突破。
K线形态,判断一些常见的大阳线、大阴线等形态作为备选买卖时机。
买入条件:价格上穿布林线下轨,Stoch指标显示超卖(K<20, D<20),快速移动均线向上突破慢速移动均线。
卖出条件:价格下穿布林线上轨,或盈利后止损。
该策略同时结合了趋势分析和超买超卖判断,降低了ecausefalse胜率,可以在趋势出现时及时进入市场。但也存在被套的风险,需要适时止损。
优势分析
结合布林线和Stoch指标,可以在股价出现明显低点时买入,降低了风险。
K线形态作为辅助条件,避免在震荡行情中错买入。
采用双重条件判断,提高了策略的稳定性和可靠性。
止损机制可以避免大幅亏损。
风险分析
布林线交易时,容易被套。行情出现断层时,可能造成较大损失。
Stoch指标发出假信号的概率较大,单独使用Stoch时,亏损风险较大。
震荡行情中,容易产生错误交易信号。
需要适时进行止损,控制风险。
需要关注突破的强度,防止冲高回落。
优化方向
优化股票池,选择波动较大、趋势明显的股票。
优化布林线参数,调整中轨周期,优化买卖点把握。
优化Stoch参数,调整K线和D线周期,提高指标可靠性。
增加成交量的条件判断,避免冲高回落。
增加止损策略,如跟踪止损、移动止损等,控制亏损风险。
评估增加其他技术指标,如MACD、KDJ等,提高策略稳定性。
测试不同持仓时间,优化获利回撤比。
总结
该策略整合布林线、Stoch指标与基本面技术指标,在控制风险的前提下,在股价低点买入,涨到历史高点附近卖出,实现了比较稳定的盈利模式。但也存在被套、止损失效等风险。通过优化参数以及增加其他判断指标,可以进一步增强策略稳定性和持续盈利能力。该策略适用于判断股价在超买超卖区域震荡时进行交易的策略投资者。
/*backtest
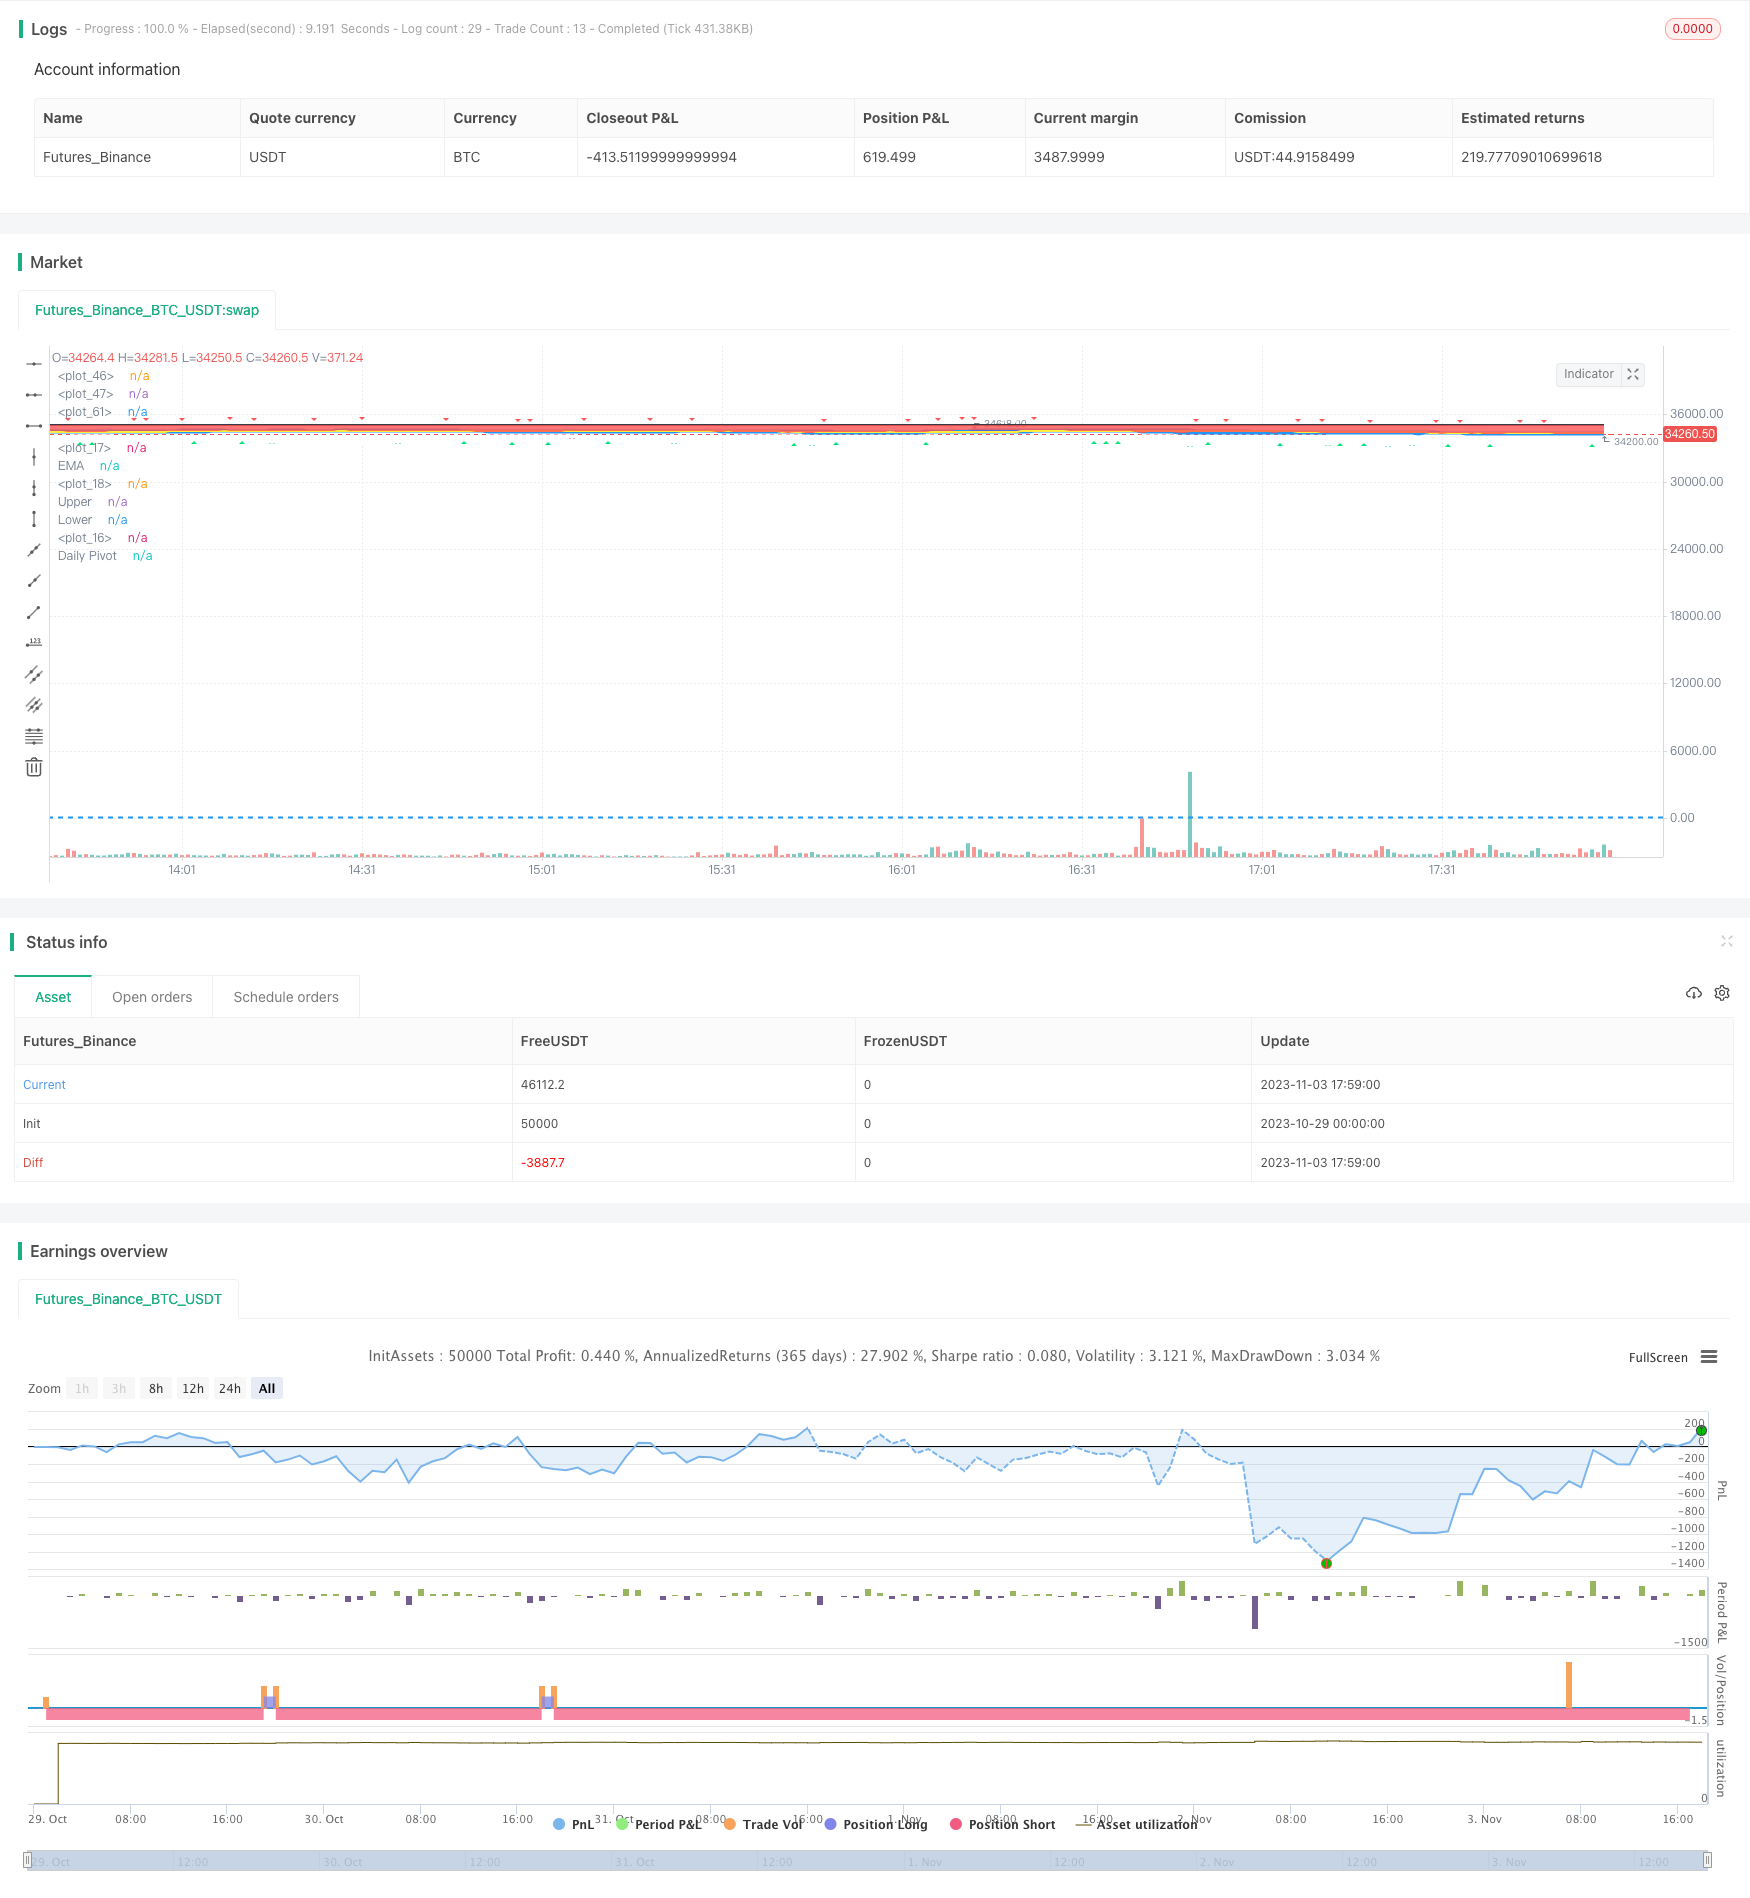
start: 2023-10-29 00:00:00
end: 2023-11-03 18:00:00
period: 1m
basePeriod: 1m
exchanges: [{"eid":"Futures_Binance","currency":"BTC_USDT"}]
*/
//@version=3
strategy("Bollinger e Tendência", overlay=true)
//MÉDIAS
periodolenta = 14
periodosimples = 47
periodome = 7
psimples = input(title="Período da média simples", defval=periodosimples)
pexp = input(title="Período da média exponencial", defval=periodome)
pexplenta = input(title="Período da média exp lenta", defval=periodolenta)
msimples = sma(close, psimples)
mexp = ema(close, pexp)
mexplenta = ema(close, pexplenta)
plot(msimples, linewidth=2, color=yellow)
plot(mexp, linewidth=5, color=white)
plot(mexplenta, linewidth=2, color=orange)
//BOLLANGER
length = input(21, minval=2)
src = input(close, title="Source")
mult = input(1.5, minval=0.001, maxval=50)
basis = sma(src, length)
dev = mult * stdev(src, length)
upperBol = basis + dev
lowerBol = basis - dev
p1 = plot(upperBol, title="Upper", color=blue, linewidth=3)
p2 = plot(lowerBol, title="Lower", color=blue, linewidth=3)
fill(p1, p2, color = purple, transp=90)
//BBW (altura do Bollanger)
basis2 = sma(close, 21)
bbw = (upperBol-lowerBol)/basis2
//STOCH E FORÇA
source = close
lengthRSI = input(11, minval=2), lengthStoch = input(7, minval=2)
smoothK = input(3,minval=3), smoothD = input(4,minval=3)
OverSold = input(20), OverBought = input(80)
rsi1 = rsi(source, lengthRSI)
k = sma(stoch(rsi1, rsi1, rsi1, lengthStoch), smoothK)
d = sma(k, smoothD)
hline(OverSold,color=blue)
hline(OverBought,color=blue)
// Cor das Tendências (Verde ou Vermelho)
// Baseado no código: "Pivot Daily Price Color" (by Rimko)
pivot = (high + low + close ) / 3.0
dtime_pivot = request.security(syminfo.tickerid, 'D', pivot[1])
pv = dtime_pivot ? dtime_pivot : na
pe = ema(close,periodome)
col = sma(close,1)>pv?green:red
col2 = sma(close,1)>pe?green:red
offs_daily = 0
pp=plot(pv, title="Daily Pivot",style=linebr, color=black,linewidth=2)
p=plot(sma(close,1), transp=100, editable=false)
pema = plot(pe, title="EMA",style=line, color=black,linewidth=2, transp = 50)
fill(p,pema,color=col2,title="EMA to price color", transp = 50)
fill(pp,p,color=col, title="Privot to price color", transp = 90)
//*************************************************************************************************************************************************
// Candles (identificação):
// Baseado no código: "Candlesticks Pattern Identified" (by Repo32)
trend= input(5, minval=1, title="Trend in Bars")
DojiSize = input(0.05, minval=0.01, title="Doji size")
data=(abs(open - close) <= (high - low) * DojiSize)
//plotchar(data, title="Doji", color=white)
plotshape(data, title="Doji", color=white, style=shape.cross)
//text='Doji'
data6=(close[1] > open[1] and open > close and open <= close[1] and open[1] <= close and open - close < close[1] - open[1] and open[trend] < open)
plotshape(data6, title= "Bearish Harami", color=red, style=shape.triangledown)
//, text="Harami\nde Baixa"
data8=(close[1] > open[1] and open > close and open >= close[1] and open[1] >= close and open - close > close[1] - open[1] and open[trend] < open)
plotshape(data8, title= "Bearish Engulfing", color=red, style=shape.triangledown)
//, text="Engolfo\nde Baixa"
data13=(open[1]<close[1] and open<=open[1] and close<=open and open[trend] < open)
plotshape(data13, title= "Bearish Kicker", color=red, style=shape.triangledown)
//, text="Kicker\nde Baixa"
data14=(((high-low>4*(open-close))and((close-low)/(.001+high-low)>=0.75)and((open-low)/(.001+high-low)>=0.75))and open[trend] < open and high[1] < open and high[2] < open)
plotshape(data14, title= "Hanging Man", location=location.belowbar, color=red, style=shape.triangledown)
//, text="Enforcado"
data7=(open[1] > close[1] and close > open and close <= open[1] and close[1] <= open and close - open < open[1] - close[1] and open[trend] > open)
plotshape(data7, title= "Bullish Harami", location=location.belowbar, color=lime, style=shape.triangleup)
//, text="Mulher\nGrávida"
data9=(open[1] > close[1] and close > open and close >= open[1] and close[1] >= open and close - open > open[1] - close[1] and open[trend] > open)
plotshape(data9, title= "Bullish Engulfing", location=location.belowbar, color=lime, style=shape.triangleup)
//, text="Engolfo\nde Alta"
//uppercandle = highest(10)[1]
data10=(close[1] < open[1] and open < low[1] and close > close[1] + ((open[1] - close[1])/2) and close < open[1] and open[trend] > open)
plotshape(data10, title= "Piercing Line", location=location.belowbar, color=lime, style=shape.triangleup)
//, text="Piercing"
lowercandle = lowest(10)[1]
data11=(low == open and open < lowercandle and open < close and close > ((high[1] - low[1]) / 2) + low[1] and open[trend] > open)
plotshape(data11, title= "Bullish Belt", location=location.belowbar, color=lime, style=shape.triangleup)
//, text="Contenção\nde Alta"
data12=(open[1]>close[1] and open>=open[1] and close>open and open[trend] > open)
plotshape(data12, title= "Bullish Kicker", location=location.belowbar, color=lime, style=shape.triangleup)//, text="Kicker\nde Alta"
data5=(((high - low)>3*(open -close)) and ((close - low)/(.001 + high - low) > 0.6) and ((open - low)/(.001 + high - low) > 0.6))
plotshape(data5, title= "Hammer", location=location.belowbar, color=white, style=shape.diamond)
data5b=(((high - low)>3*(open -close)) and ((high - close)/(.001 + high - low) > 0.6) and ((high - open)/(.001 + high - low) > 0.6))
plotshape(data5b, title= "Inverted Hammer", location=location.belowbar, color=white, style=shape.diamond)
//, text="Martelo\nInvertido"
data2=(close[2] > open[2] and min(open[1], close[1]) > close[2] and open < min(open[1], close[1]) and close < open )
//plotshape(data2, title= "Evening Star", location=location.belowbar, color=red, style=shape.arrowdown, text="Estrela\nda Tarde")
plotchar(data2, title="Evening Star", color=white)
data3=(close[2] < open[2] and max(open[1], close[1]) < close[2] and open > max(open[1], close[1]) and close > open )
//plotshape(data3, title= "Morning Star", location=location.belowbar, color=lime, style=shape.arrowup, text="Estrela\nda Manhã")
plotchar(data3, title="Morning Star", color=white, location=location.belowbar)
data4=(open[1] < close[1] and open > close[1] and high - max(open, close) >= abs(open - close) * 3 and min(close, open) - low <= abs(open - close))
//plotshape(data4, title= "Shooting Star", color=red, style=shape.arrowdown, text="Estrela\nCadente")
plotchar(data4, title="Shooting Star", color=white)
//**********************************************************************************************************
// Ações:
momento = strategy.position_size[0] > strategy.position_size[1]
valorcompra = valuewhen(momento, open, 0)
valorbbw = input(title="Altura Máxima do Bollinger", defval=10)
alerta = crossunder(close, lowerBol)
alertcondition(alerta, title='Abaixo da Banda Baixa', message='Fechou abaixo da banda baixa...!')
//data7 data9 data10 data11 data12
compra = crossover(close, lowerBol) and ((k<=20) and (d<=20)) and (mexp>mexp[1])
//compra = (data7 or data9 or data10 or data11 or data12) and (msimples>msimples[1]) and ((k<=20) and (d<=20)) and (bbw<valorbbw/1000)
//compra = (open<close) and (crossover (close, lowerBol)) and ((k<=20) and (d<=20)) and (bbw<valorbbw/1000) and (msimples>msimples[1])
venda = crossover(close, upperBol)
//(close >= (valorcompra + (valorcompra * 0.025)))
strategy.entry ("Compra", strategy.long, when=compra)
strategy.entry ("Venda", strategy.short, when=venda)
//plotshape(series=compra, title="Compra", style=shape.triangleup, location=location.belowbar, color=green, text="COMPRA", size=size.small)
//plotshape(series=venda, title="Venda", style=shape.triangledown, location=location.abovebar, color=red, text="VENDA", size=size.small)