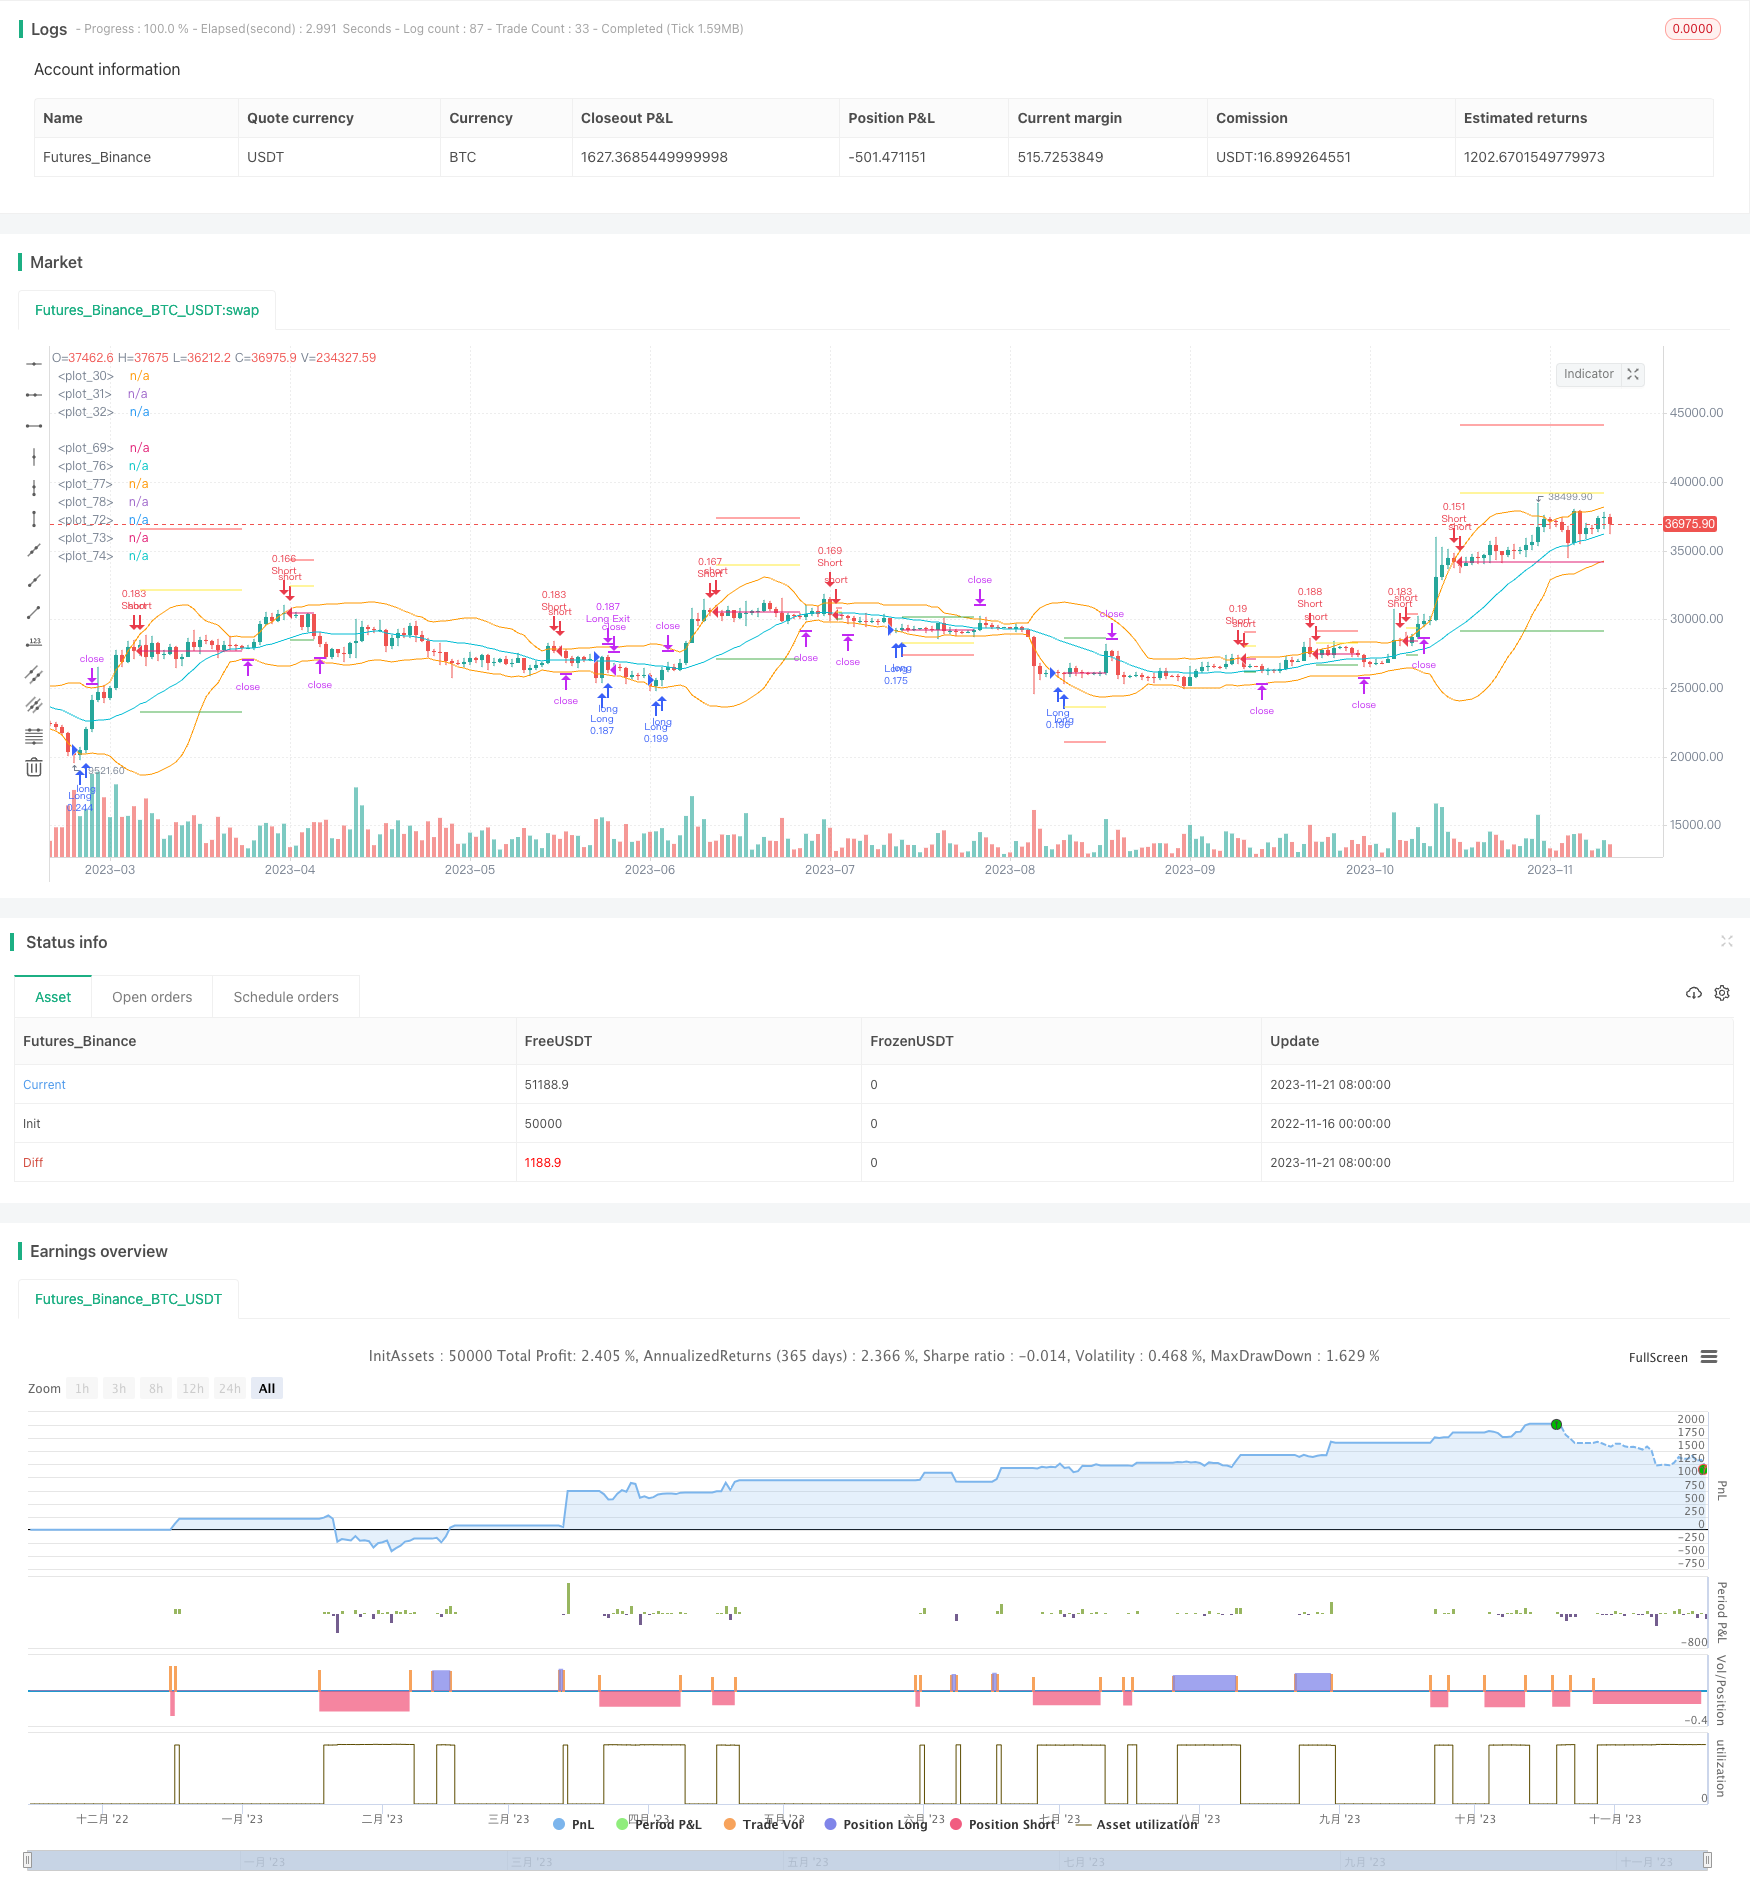
Estrategia de cruces dorados y cruces muertos con bandas de Bollinger

Descripción general
La estrategia se basa en el Brin Belt Gold Fork Dead Fork para hacer más tomas de posición. Cuando el precio rompe la banda de Brin en la vía, hacer una tomada de posición; cuando el precio rompe la banda de Brin en la vía, hacer más. Durante la tenencia de la posición, se realizan alzas de posición y seguimiento de stop loss.
Principio de estrategia
La estrategia utiliza las 3 trayectorias arriba y abajo de la banda de Brin. La trayectoria media de la banda de Brin es la media móvil de n días, la trayectoria superior es la diferencia estándar de n días de la trayectoria media + k veces, y la trayectoria inferior es la diferencia estándar de n días de la trayectoria media-k veces.
Cuando el precio se rompe de abajo hacia arriba, indica que el precio comienza a subir, y entonces se hace más; cuando el precio se rompe de arriba hacia abajo, indica que el precio comienza a bajar, y entonces se hace vacío.
Después de hacer un shorting adicional, se continuará con la subida de posiciones. La condición de subida de posiciones es sobre la base de las posiciones que se han mantenido, si el precio vuelve a tocar la línea media, se abrirá una nueva posición para hacer un shorting adicional o un shorting adicional.
El seguimiento de la pérdida de todas las posiciones también se actualiza en tiempo real. La línea de pérdida de la pérdida se establece en función de la diferencia entre el precio promedio de la posición actual y el precio de la franja de Brin.
Análisis de las ventajas
La estrategia tiene las siguientes ventajas:
- El uso de un indicador de la banda de Brin para capturar brechas en los precios y hacer más deuda al descubierto
- La entrada en el país se ha regularizado mediante el método de la horca dorada.
- La gente que mantiene una posición aumenta su posición para ganar más dinero.
- Actualización en tiempo real para evitar impactos
Análisis de riesgos
La estrategia también tiene sus riesgos:
- Las bandas Brin como indicadores son más sensibles a las fluctuaciones del mercado y pueden ser objeto de arbitraje.
- El acaparamiento de activos aumenta la brecha de riesgo y aumenta las pérdidas.
- La línea de parada no es absoluta, pero puede ser que haya un obstáculo
En cuanto a los riesgos, se puede optimizar en los siguientes aspectos:
- Ajustar los parámetros de la banda de Bryn para adaptarse a diferentes ciclos
- Optimización de la amplitud y la frecuencia de las prórrogas
- Aumento de la vía media como una línea de parada adicional
Dirección de optimización
La estrategia puede ser optimizada en los siguientes aspectos:
- Optimización de los parámetros de la cinta de Brin para adaptarse a un mayor número de mercados
- Optimizar la lógica de la hipoteca, equilibrando el riesgo y los beneficios
- Aumentar la línea de pérdida, como la pérdida de la vía media
- Aumentar las estrategias de contención y ser más proactivos
- En combinación con otros indicadores, filtra el tiempo de entrada
- Optimizar la gestión de fondos y controlar el riesgo individual
Resumir
Esta estrategia en su conjunto es una estrategia típica de seguimiento de la tendencia. Puede ser una estrategia de fluctuación y obtener ganancias cuando se presenta una tendencia. Al mismo tiempo, también tiene un cierto riesgo y necesita ser optimizada y mejorada para adaptarse a más situaciones de mercado y reducir el riesgo de falsos breaks.
/*backtest
start: 2022-11-16 00:00:00
end: 2023-11-22 00:00:00
period: 1d
basePeriod: 1h
exchanges: [{"eid":"Futures_Binance","currency":"BTC_USDT"}]
*/

//@version=5

strategy(title='Bollinger Band strategy with split, limit, stop', shorttitle='bb strategy', overlay=true,commission_type = strategy.commission.percent, commission_value = 0.01, default_qty_type = strategy.percent_of_equity, default_qty_value = 10, pyramiding = 4)


//Summary: Going Long or Short when Entering after Breaking the Bollinger Bands\
//At this time, the stop-loss, profit-taking price, and pyramiding standard\
// are determined from the difference between the position average price and the band price.

//After entering the position, if the price crosses the mid-band line, the stop loss is adjusted to the mid-band line.


//each trade, entry position size = 10% of total cash
//max pyramiding is 4
//commission = 0.01%


in_period = true


bb_length = input.int(20)
bb_mult = input.int(2)

[middle, upper, lower] = ta.bb(close,bb_length, bb_mult)
plot(middle, color=color.aqua)
plot(upper, color=color.orange)
plot(lower, color=color.orange)
long_cond = ta.crossover(close,lower)
short_cond = ta.crossunder(close,upper)

var saved_ph = 0.0
if strategy.opentrades>0 and strategy.opentrades[1]==0 and strategy.position_size > 0
    saved_ph := upper[1]
var saved_pl = 0.0
if strategy.opentrades>0 and strategy.opentrades[1]==0 and strategy.position_size < 0
    saved_pl := lower[1]

avg = strategy.position_avg_price

long_diff = saved_ph-avg
short_diff = saved_pl-avg

long_stoploss = avg - 1*long_diff
short_stoploss = avg - 1*short_diff

long_avgdown = avg - 0.5*long_diff
short_avgup = avg - 0.5*short_diff

long_profit_price = avg + 0.5*long_diff
short_profit_price = avg + 0.5*short_diff

var label _label = na
if in_period
    if long_cond and strategy.opentrades==0
        strategy.entry("Long",strategy.long)
    if long_cond and strategy.opentrades >0 and (close[1]<long_avgdown or close[2]<long_avgdown)
        strategy.entry("Long",strategy.long)

    if short_cond and strategy.opentrades==0
        strategy.entry("Short", strategy.short)
    if short_cond and strategy.opentrades>0 and (close[1]>short_avgup or close[2]>short_avgup)
        strategy.entry("Short",strategy.short)

plot(avg, style=plot.style_linebr)


plot(strategy.position_size > 0? long_profit_price: na,color=color.green, style=plot.style_linebr)
plot(strategy.position_size > 0? long_avgdown: na,color=color.yellow, style=plot.style_linebr)
plot(strategy.position_size > 0? long_stoploss: na,color=color.red, style=plot.style_linebr)

plot(strategy.position_size < 0? short_profit_price: na,color=color.green, style=plot.style_linebr)
plot(strategy.position_size < 0? short_avgup: na,color=color.yellow, style=plot.style_linebr)
plot(strategy.position_size < 0? short_stoploss: na,color=color.red, style=plot.style_linebr)

if strategy.position_size > 0
    if ta.crossover(close, middle)
        strategy.exit("Long Exit", "Long", limit=long_profit_price, stop=middle)
    else
        strategy.exit("Long Exit", "Long", limit=long_profit_price, stop=long_stoploss)
if strategy.position_size < 0
    if ta.crossunder(close, middle)
        strategy.exit("Short Exit", "Short", limit=short_profit_price, stop=middle)
    else
        strategy.exit("Short Exit", "Short", limit=short_profit_price, stop=short_stoploss)