概述
Momentum Alpha策略通过计算标的资产的夏普比率和Alpha值,判断其是否存在正的Momentum效应。当夏普比率和Alpha同时为正时,认为资产存在Momentum,做多;当指标值同时为负时,平仓。
策略原理
该策略的核心指标是夏普比率和Alpha。夏普比率反映资产的风险调整后收益,Alpha反映资产相对市场基准的超额收益。当二者同时为正,说明资产具有较高的风险调整收益和较市场为优的绩效,因此做多;当二者同时为负,说明Momentum消失,因此平仓。
具体来说,策略首先计算最近180天的夏普比率。夏普比率的计算公式为:(日收益率均值 - 无风险收益率) / 日收益率标准差。这里使用开盘价和前一日收盘价计算日收益率的均值和标准差。当夏普比率大于1时,说明资产的风险调整后收益较高。
同时,策略计算最近180天的Alpha。Alpha通过市场模型计算:Alpha = 资产实际收益率 - (市场收益率 × Beta)。这里使用标的资产的日收益率和标准普尔500指数的日收益率进行计算。当Alpha大于0时,说明资产的实际收益高于市场基准收益。
因此,当夏普比率和Alpha同时为正时,做多;当二者同时为负时,平仓。
优势分析
该策略最大的优势在于通过Momentum判断,能够捕捉大盘和部分股票在特定时期的增长机会,此外通过控制风险,可以避免长期的股灾。具体分析如下:
计算夏普比率反映最近期的Momentum情况,可以抓住一些大盘和股票的拉升上涨期。计算Alpha反映相对基准的超额收益,可以滤除较弱的标的。
通过综合考虑夏普比率和Alpha,同时控制长短期Momentum,可以更准确判断是否具有正的Momentum。
当Momentum消失时,及时止损,避免较大亏损。这就是在拉升行情过后及时止盈的策略。
相比单一Momentum指标,该策略更稳定,同时也更灵活,可以在股票和大盘上都使用。
风险分析
尽管该策略有一定优势,但依然存在以下风险:
Momentum指标存在回撤的可能。当市场发生转折,Momentum股可能面临较快下跌。此时策略会亏损较大。可以适当调整参数,或考虑与其他指标组合使用。
Alpha和夏普比率指标计算存在时间滞后。当市场快速变化时,指标数值可能滞后,无法及时反映最新趋势变化。可以考虑缩短计算周期。
多空仓位没有控制,可能导致风险过于集中。可以考虑根据市场情况或资金情况适当控制仓位规模。
回测数据可能不足,实盘效果存疑。应增加更长时间段和不同品种的回测验证。同时缩短参数优化周期,避免过拟合。
优化方向
该策略还可以从以下几个方面进行优化:
增加止损机制。当价格出现较大单日跌幅时,可以设置止损点,避免出现大额亏损。
增加仓位管理。可以根据市场波动率等指标控制每次开仓的资金量。降低单笔损失风险。
优化参数。可以测试不同时间周期的参数,使之更符合不同标的和市况的特征。同时也可以测试不同的参数组合效果。
增加过滤条件。可以设置交易量或者波动率等其他条件。避免掉入一些震荡 Healthcare 或低流动性的陷阱。
组合其他策略。可以考虑与类似的趋势跟踪策略组合使用。既可以增强效果stabilit,又可以分散单一策略的风险。
总结
Momentum Alpha策略通过同时判断资产的风险调整收益和相对市场表现,动态捕捉正Momentum的机会。与单一Momentum指标相比,具有判断更为准确,适用范围更广,抗风险能力更强的优势。但该策略依然存在一定的回撤和滞后风险,需要反复优化与组合其他策略使用,才能在实盘中稳定获利。
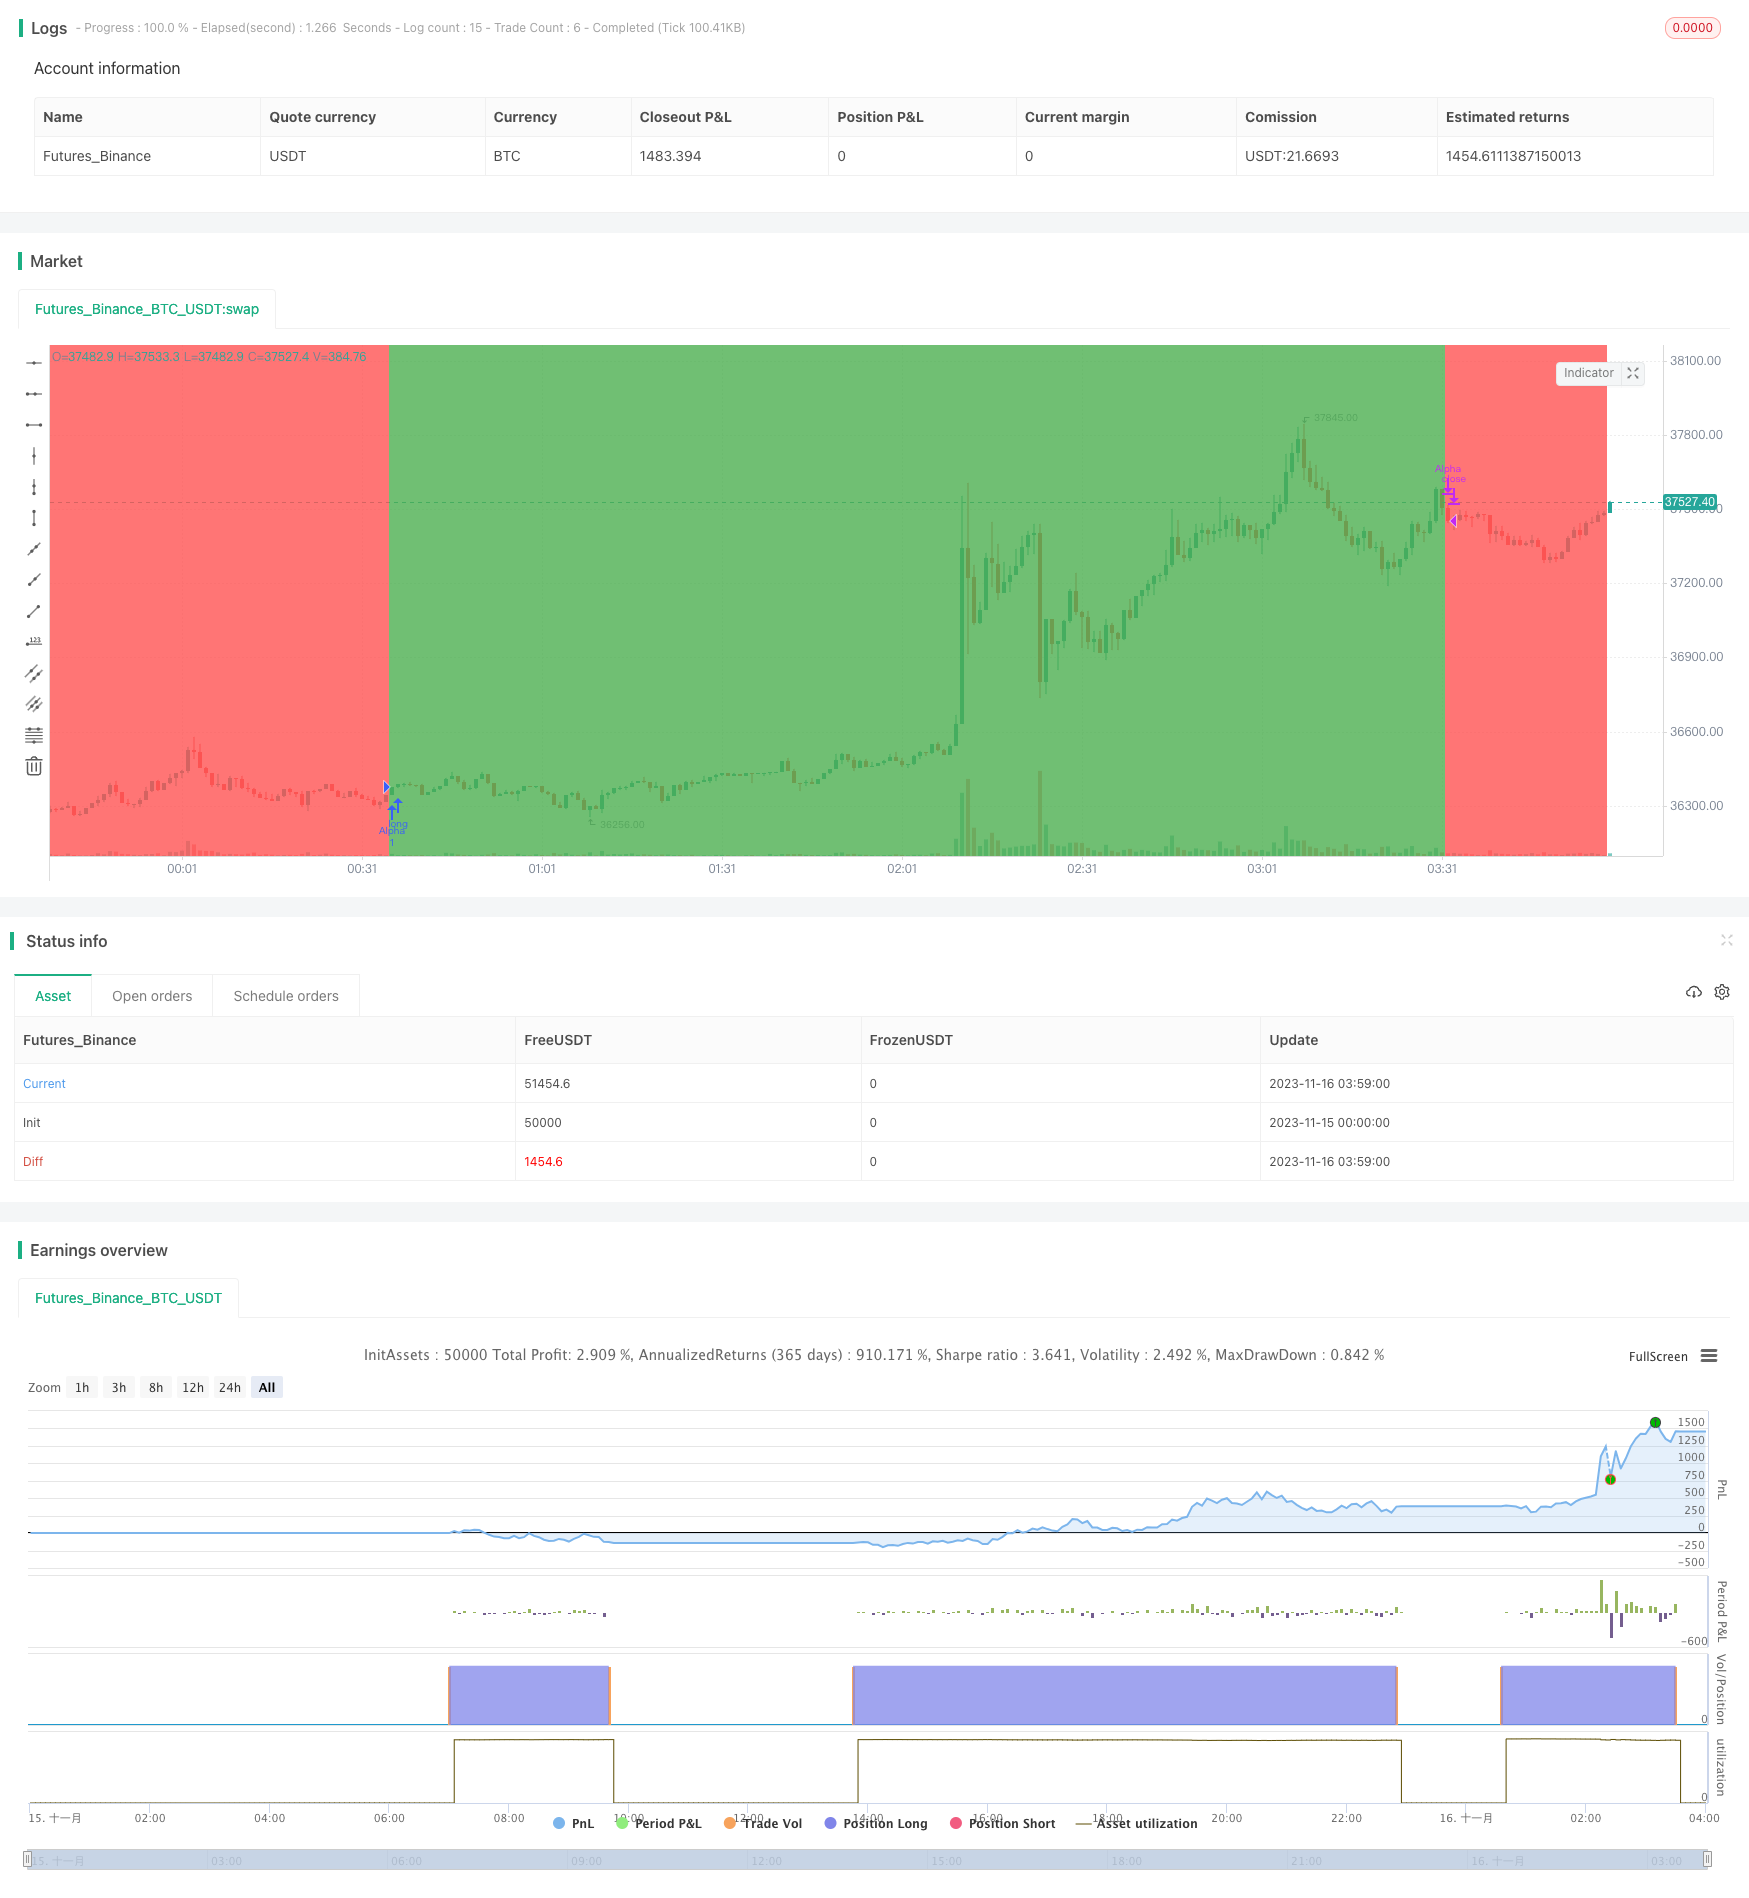
/*backtest
start: 2023-11-15 00:00:00
end: 2023-11-16 04:00:00
period: 1m
basePeriod: 1m
exchanges: [{"eid":"Futures_Binance","currency":"BTC_USDT"}]
*/

//@version=2
strategy("Alpha strategy - simple version", overlay=true)

//by NIKLAUS
//USE ON DAILY TIMEFRAME TO DETECT MOMO STOCKS & ETFs AND TRADE THEM
//USE ON 5MIN CHART FOR INTRADAY USAGE
//examples to try this on: GER30, NAS100, JPN225, AAPL, IBB, TSLA, FB, etc.

//This Strategy goes long when Sharpe Ratio is > 1 and Alpha against the S&P500 is generated. It exits when conditions break away.

//https://en.wikipedia.org/wiki/Alpha_(finance)
//------------------------------------------------------------------------------------------------------------------------------------
//Alpha is a measure of the active return on an investment, the performance of that investment compared to a suitable market index.
//An alpha of 1% means the investment's return on investment over a selected period of time was 1% better than the market during that same period,
//an alpha of -1 means the investment underperformed the market.
//Alpha is one of the five key measures in modern portfolio theory: alpha, beta, standard deviation, R-squared and the Sharpe ratio.


//simplified sharpe
src = ohlc4, len = input(180, title = "Sharpe/Alpha/Beta Period")
pc = ((src - src[len])/src)
std = stdev(src,len)
stdaspercent = std/src
sharpe = pc/stdaspercent


//alpha
sym = "BTC_USDT:swap", res=timeframe.period, src2 = close
ovr = request.security(sym, res, src2)

ret = ((close - close[1])/close)
retb = ((ovr - ovr[1])/ovr)
secd = stdev(ret, len), mktd = stdev(retb, len)
Beta = correlation(ret, retb, len) * secd / mktd

ret2 = ((close - close[len])/close)
retb2 = ((ovr - ovr[len])/ovr)

alpha = ret2 - retb2*Beta
//plot(Beta, color=green, style=area, transp=40)


smatrig = input(title="Sensitivity",  defval=2, minval=1, maxval=3)
bgcolor (sma(sharpe,len/smatrig) > 1 and sma(alpha,len/smatrig) > 0 ? green : red, transp=70)

if (close > open) and (sma(sharpe,len/smatrig) > 1) and (sma(alpha,len/smatrig) > 0)
    strategy.entry("Alpha", strategy.long)
strategy.close("Alpha", when = (sma(sharpe,len/smatrig) < 1) or (sma(alpha,len/smatrig) < 0))