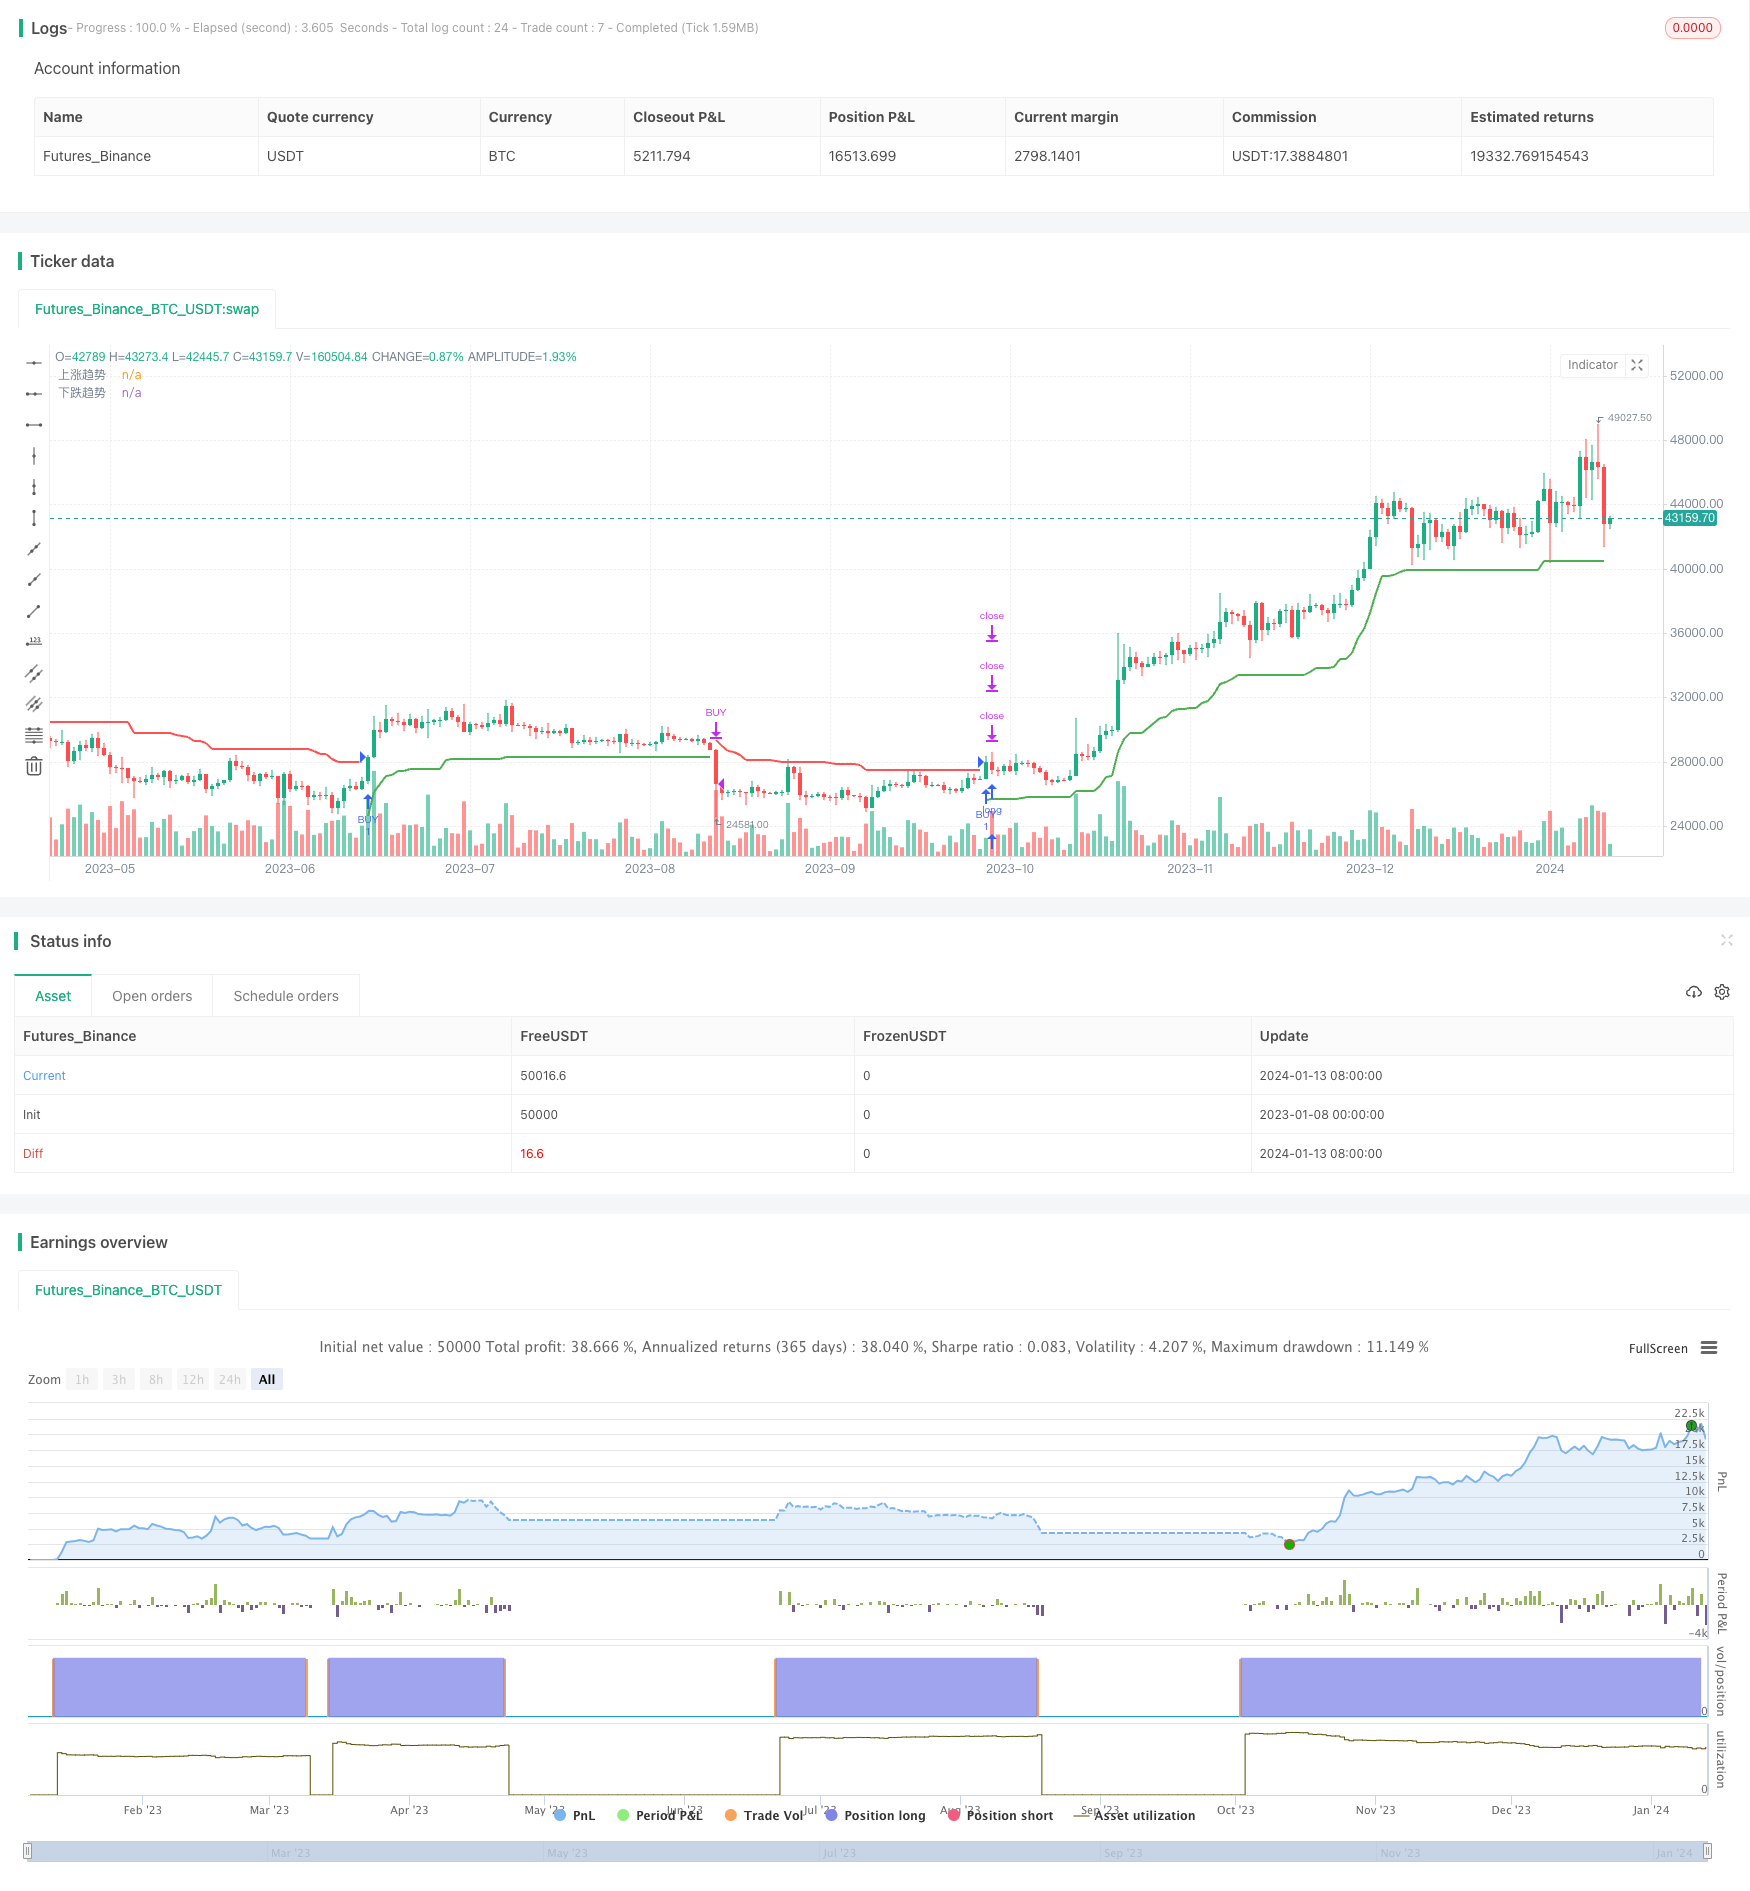
Estrategia de seguimiento de super tendencias de varios marcos de tiempo
El autor:¿ Qué pasa?, Fecha: 15 de enero de 2024 11:35:47Las etiquetas:

Resumen general
Esta estrategia utiliza el indicador ATR para construir un canal de tendencia dinámica de varios marcos de tiempo para rastrear las tendencias.
Estrategia lógica
La estrategia utiliza el indicador ATR para construir un canal de tendencia alcista y un canal de tendencia bajista. Específicamente, la línea del canal de tendencia alcista es el precio de cierre menos N veces el indicador ATR; la línea del canal de tendencia bajista es el precio de cierre más N veces el indicador ATR. El valor de N se puede ajustar a través de parámetros.
Cuando el precio rompe el canal de tendencia alcista, se genera una señal de compra; cuando el precio rompe el canal de tendencia bajista, se genera una señal de venta.
Además, la estrategia también define una variable de tendencia para determinar si la corriente está en una tendencia alcista o bajista.
Ventajas
- Utiliza canales dinámicos para rastrear tendencias y comerciar junto con las tendencias
- Evita perseguir los máximos y vender los mínimos, reduciendo el riesgo de inversión del mercado
- Parámetros del canal ajustables, alta adaptabilidad
- Configuración de marcos de tiempo más flexibles
Los riesgos
- El seguimiento demasiado agresivo puede aumentar el riesgo de pérdida
- La configuración incorrecta de los parámetros del canal conduce a menos o más señales incorrectas
- Requiere una sólida habilidad de programación para ajustar los parámetros
Mejoramiento:
- Reducir adecuadamente el multiplicador ATR a una magnitud de seguimiento más baja
- Optimiza los parámetros para encontrar la mejor combinación
- Añadir una estrategia de stop loss para reducir la pérdida por operación
Direcciones de optimización
- Añadir otros indicadores para filtrar señales más fiables
- Añadir una estrategia de stop loss para reducir el riesgo
- Realizar la optimización de parámetros para encontrar óptimo
- Optimizar el momento de entrada y salida para mejorar la tasa de ganancia
Resumen de las actividades
En general, esta es una estrategia de seguimiento de tendencias decente. Se ajusta dinámicamente al comercio junto con las tendencias y evita perseguir los máximos y los mínimos de venta. Con la optimización de parámetros y las mejoras adecuadas, las ventajas de la estrategia se pueden mejorar aún más y los riesgos se pueden reducir para lograr mejores resultados.
/*backtest
start: 2023-01-08 00:00:00
end: 2024-01-14 00:00:00
period: 1d
basePeriod: 1h
exchanges: [{"eid":"Futures_Binance","currency":"BTC_USDT"}]
*/

//@version=5
strategy('超级趋势精简优化版', overlay=true)
Periods = input(title='ATR周期', defval=10)
src = input(hl2, title='价格数据源')
Multiplier = input.float(title='ATR 乘数', step=0.1, defval=3.0)
changeATR = input(title='更改ATR计算方法', defval=true,tooltip = '默认为art否则sma(ta.tr,ATR周期)')
showsignals = input(title='显示买入/卖出信号', defval=false)
atr2 = ta.sma(ta.tr, Periods)
atr = changeATR ? ta.atr(Periods) : atr2
up = src - Multiplier * atr
up1 = nz(up[1], up)
up := close[1] > up1 ? math.max(up, up1) : up
dn = src + Multiplier * atr
dn1 = nz(dn[1], dn)
dn := close[1] < dn1 ? math.min(dn, dn1) : dn
trend = 1
trend := nz(trend[1], trend)
trend := trend == -1 and close > dn1 ? 1 : trend == 1 and close < up1 ? -1 : trend
upPlot = plot(trend == 1 ? up : na, title='上涨趋势', style=plot.style_linebr, linewidth=2, color=color.new(color.green, 0))
buySignal = trend == 1 and trend[1] == -1
plotshape(buySignal and showsignals ? up : na, title='买点', text='买点', location=location.absolute, style=shape.labelup, size=size.tiny, color=color.new(color.green, 0), textcolor=color.new(color.white, 0))
dnPlot = plot(trend == 1 ? na : dn, title='下跌趋势', style=plot.style_linebr, linewidth=2, color=color.new(color.red, 0))
sellSignal = trend == -1 and trend[1] == 1
plotshape(sellSignal and showsignals ? dn : na, title='卖点', text='卖点', location=location.absolute, style=shape.labeldown, size=size.tiny, color=color.new(color.red, 0), textcolor=color.new(color.white, 0))
FromMonth = input.int(defval=9, title='From Month', minval=1, maxval=12)
FromDay = input.int(defval=1, title='From Day', minval=1, maxval=31)
FromYear = input.int(defval=2018, title='From Year', minval=999)
ToMonth = input.int(defval=1, title='To Month', minval=1, maxval=12)
ToDay = input.int(defval=1, title='To Day', minval=1, maxval=31)
ToYear = input.int(defval=9999, title='To Year', minval=999)
start = timestamp(FromYear, FromMonth, FromDay, 00, 00)
finish = timestamp(ToYear, ToMonth, ToDay, 23, 59)
window() =>
    time >= start and time <= finish ? true : false
longCondition = buySignal
if longCondition and window()
    strategy.entry('BUY', strategy.long, comment = '买入')
shortCondition = sellSignal
if shortCondition and window()
    strategy.close('BUY',comment = '卖出')
buy1 = ta.barssince(buySignal)
sell1 = ta.barssince(sellSignal)
color1 = buy1[1] < sell1[1] ? color.green : buy1[1] > sell1[1] ? color.red : na
- Tendencia siguiendo la estrategia de ruptura del canal con media móvil y parada de seguimiento
- Estrategia de doble indicador de negociación cuantitativa
- Estrategia de negociación de media móvil bidireccional de reversión
- RSI Estrategia de negociación de la divergencia alcista y bajista
- Estrategia de la bala de plata basada en el escape de la caja
- Seguimiento de la estrategia de tendencia basada en indicadores de doble EMA y CA
- Estrategia de tendencia de la EMA para la ruptura de la volatilidad con retraso cero
- Estrategia sólida de seguimiento de tendencias
- Estrategia de promedio móvil de ruptura en espiral
- Estrategia de negociación cuantitativa basada en el indicador de supertendencia y la negociación de curvas de renta variable
- Estrategia de cruce de dos medias móviles
- Tendencia de seguir la estrategia con stop loss
- Estrategia de detención de tracción basada en ATR para los vehículos eléctricos
- Estrategia de negociación de inversión MACD doble
- Estrategia de negociación cuantitativa - Seguimiento de tendencias cuantitativas
- Tendencia siguiendo una estrategia basada en la diferencia de la media móvil
- Estrategia de negociación de inercia de inversión de doble factor cuantitativa
- Seguimiento de tendencias Estrategia de ruptura de la EMA
- Estrategia de negociación cuántica basada en la nube Ichimoku
- Estrategia de reversión de la tendencia criptográfica basada en los puntos altos y bajos de los oscilaciones pivot