Estrategia de Stop Loss y Take Profit basada en el patrón Doji
El autor:¿ Qué pasa?, Fecha: 2024-02-02 17:17:38Las etiquetas:

Resumen general
Esta estrategia se basa en el patrón Doji. Cuando aparece un patrón Doji, se coloca una orden de stop de compra entre el máximo del Doji y el máximo de la vela anterior, y una orden de stop de venta se coloca entre el mínimo del Doji y el mínimo de la vela anterior. Cuando el precio activa las órdenes de stop, puede elegir salir con stop loss fijo y obtener ganancias, o usar el precio más alto y más bajo del patrón Doji como stop loss y obtener ganancias. Esta estrategia funciona bien en marcos de tiempo más altos como diarios y semanales para filtrar el ruido.
Estrategia lógica
Cuando aparece un patrón Doji, indica un cambio en la relación de oferta y demanda, con fuerzas que se vuelven más equilibradas, lo que puede conducir a una inversión de precios.
body=close-open
range=high-low
abody=abs(body)
ratio=abody/range
data=(abs(open - close) <= (high - low) * Doji)
Si abs ((abierto-cerrado) <= (alto-bajo) * Parámetro Doji, se considera un patrón Doji y se colocarán órdenes de parada.
longDist= longcandle[1] and range[1]>range? high: max(high,high[1])
shortDist= longcandle[1] and range[1]>range? low: min(low,low[1])
Si el cuerpo de la vela anterior es grande, la orden de compra se coloca entre el máximo del Doji y el máximo de la vela anterior. Si la vela anterior tiene un cuerpo pequeño, la orden de compra se coloca en el máximo del Doji. La orden de venta sigue la misma lógica.
Hay dos opciones para las salidas:
- Pérdidas fijas de detención y ganancias
strategy.exit("exit buy","buy stop",loss=SL, profit=TP, when=Use_SL_TP)
- Utilice el precio más alto y más bajo de Doji como stop loss y take profit
strategy.close("buy stop",when=not Use_SL_TP and close<dojilow)
Análisis de ventajas
Las ventajas de esta estrategia son:
- Es sencillo de implementar.
- Aprovecha las señales de inversión de precios eficientes del patrón Doji.
- Parámetros de stop loss y take profit personalizables para controlar el riesgo.
- Funciona bien en períodos de tiempo más largos para filtrar el ruido.
Análisis de riesgos
Hay algunos riesgos con esta estrategia:
- La solución es establecer razonablemente la distancia de stop loss para limitar la pérdida por operación.
- Demasiado ruido en las señales Doji en marcos de tiempo más bajos.
- El riesgo de pérdidas ilimitadas sin stop loss y take profit.
Direcciones de optimización
Algunas maneras de optimizar la estrategia:
- Optimizar el parámetro Doji para diferentes instrumentos comerciales.
- Prueba diferentes combinaciones de stop loss y take profit.
- Pérdida de parada dinámica basada en ATR.
- Combinar con otros indicadores para determinar la entrada óptima.
Conclusión
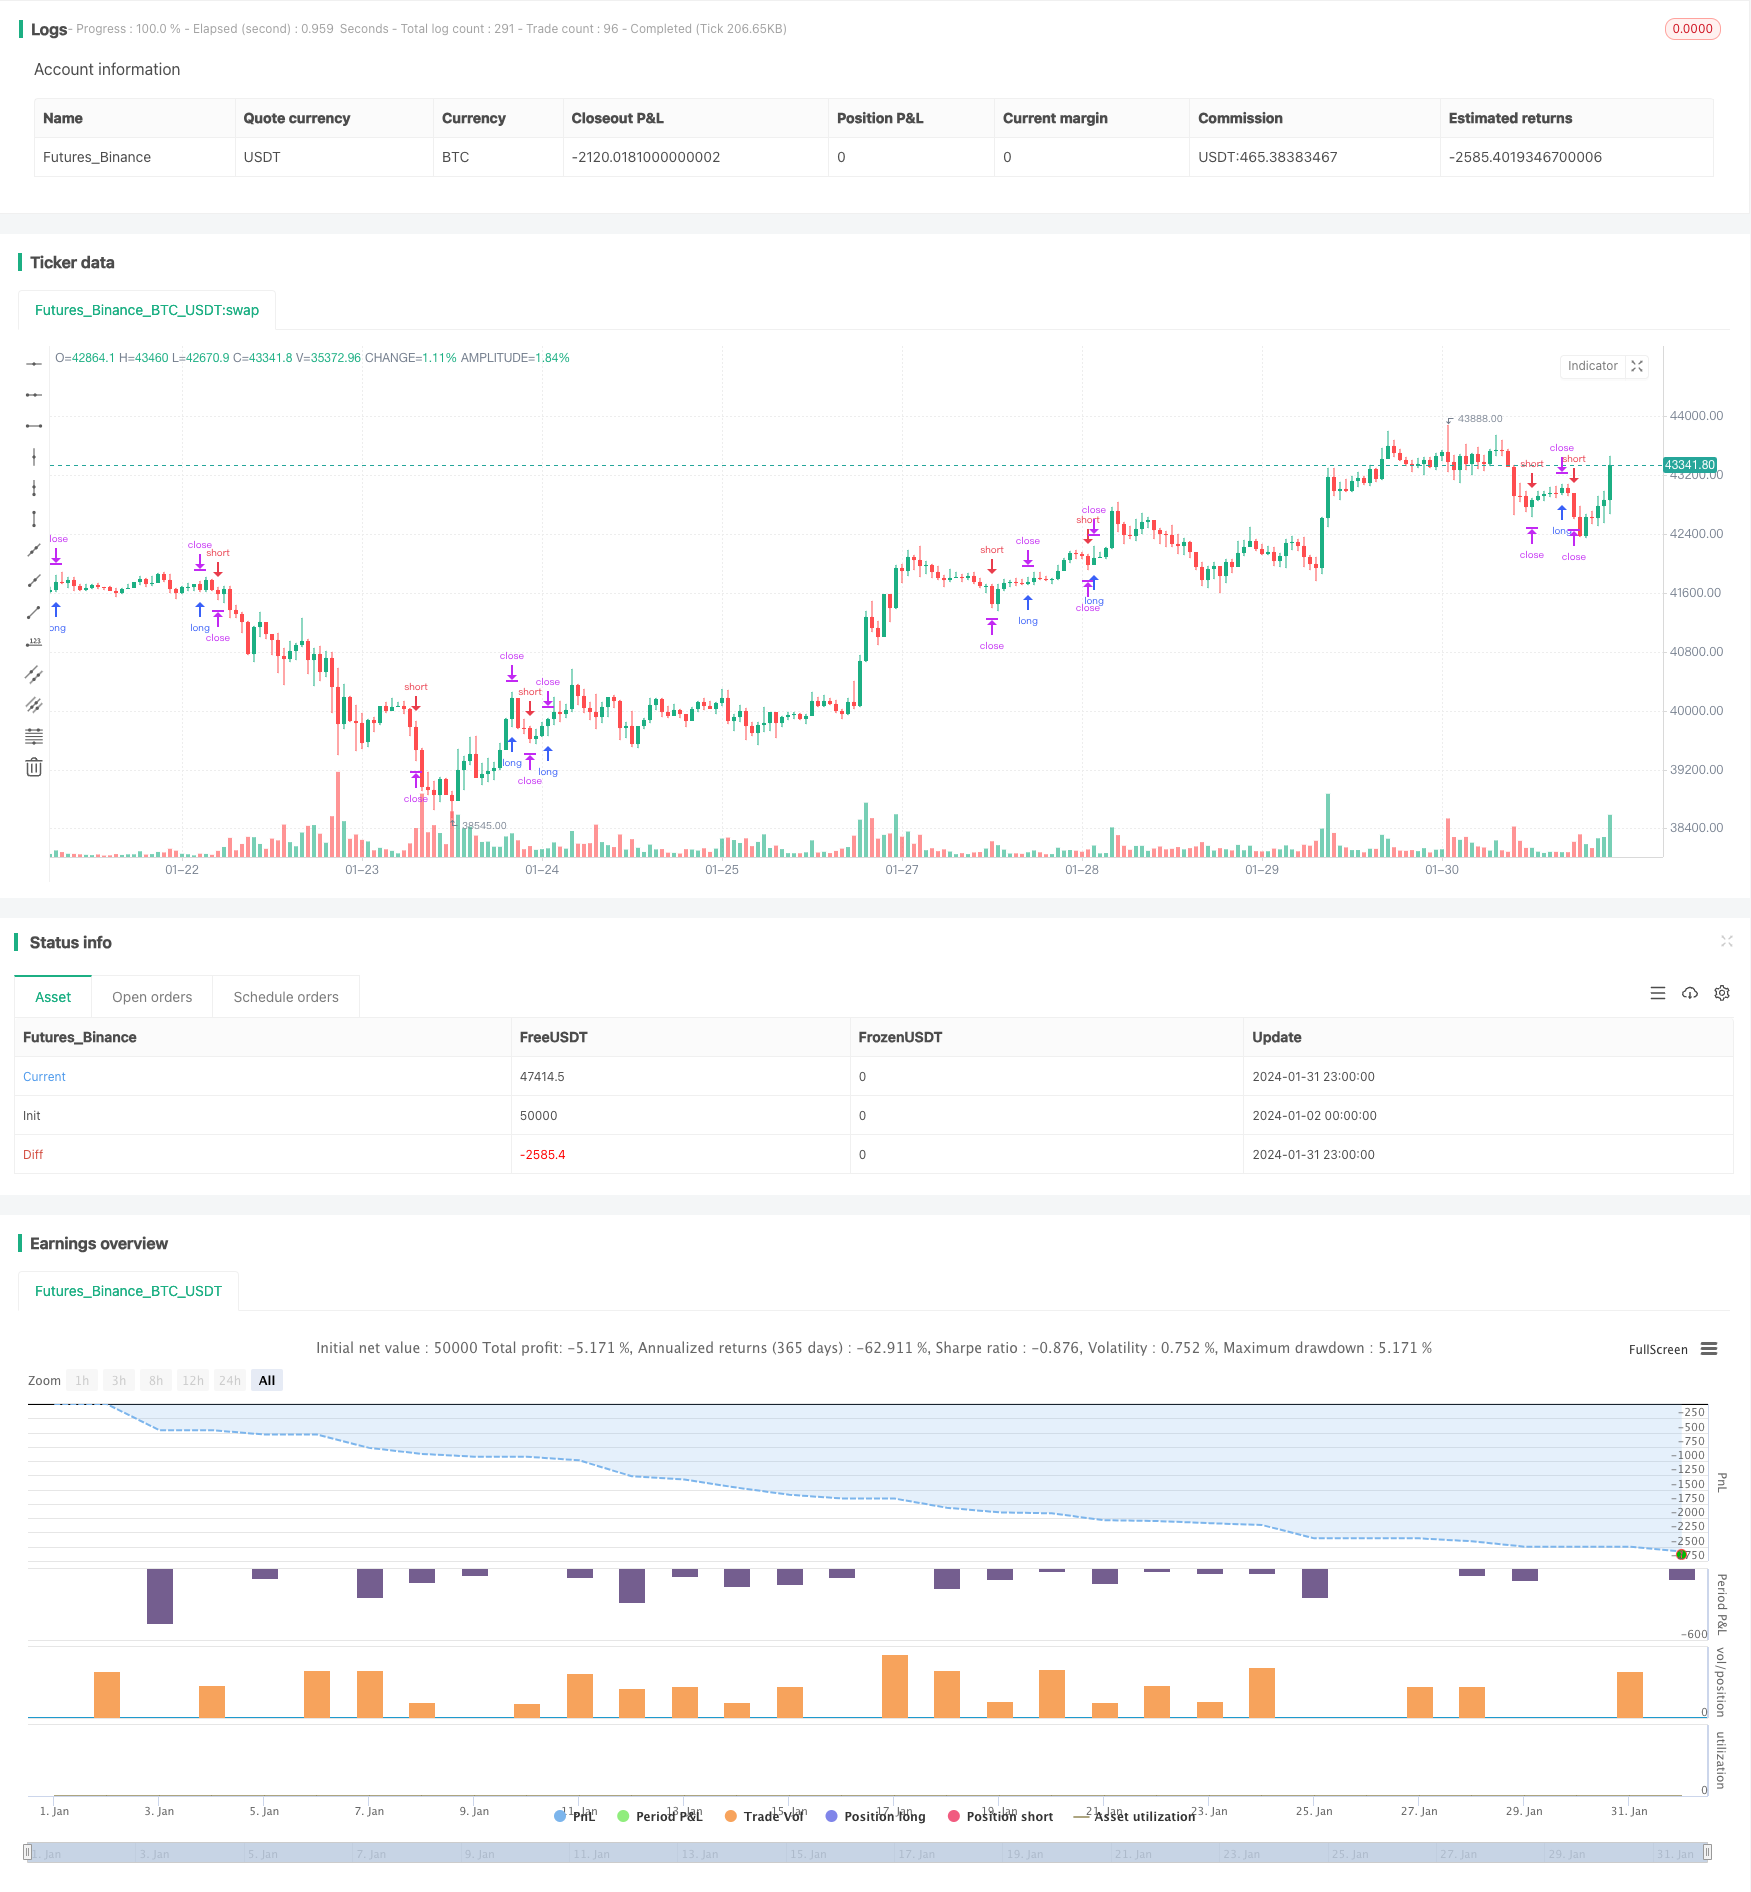
El rendimiento general de esta estrategia es bueno. Al capturar las oportunidades de reversión del precio de Doji, puede generar señales comerciales decentes. También es simple de implementar y aplicable a múltiples instrumentos. Con pruebas y optimizaciones continuas, se pueden esperar mejores resultados.
/*backtest
start: 2024-01-02 00:00:00
end: 2024-02-01 00:00:00
period: 1h
basePeriod: 15m
exchanges: [{"eid":"Futures_Binance","currency":"BTC_USDT"}]
*/

//@version=3
//This is a simple strategy based on Doji star candlestick
//It places two orders: buy stop at doji star high or previous candle high and sell stop at doji star low or previous candle low.
//This strategy works very well with high time frames like Weekly TF because it eliminates the noise in doji formation.
//

strategy("Doji strategy W", overlay=true, calc_on_every_tick=true, pyramiding=0,default_qty_type=strategy.percent_of_equity,default_qty_value=100,currency=currency.USD)

//INPUTS
//MinDistance=input(100,'Minimum distance in ticks')
Use_SL_TP=input(true,'Use stop loss and take profit?')
TP=input(200,'Take Profit in ticks')
SL=input(200,'Stop Loss in tiks')
Doji = input(0.05, minval=0.01, title="Doji size", step=0.01)

//VARIABILI
body=close-open
range=high-low
abody=abs(body)
ratio=abody/range
longcandle= (ratio>0.6)

//Doji
data=(abs(open - close) <= (high - low) * Doji)
plotchar(data, title="Doji", text='Doji', color=black)
longDist= longcandle[1] and range[1]>range? high: max(high,high[1])
shortDist= longcandle[1] and range[1]>range? low: min(low,low[1])
dojilow=data==1?low:na
dojihigh=data==1?high:na

goStar=data==1?true:false
//////////////////////////////////////////////////////////////////

//STRATEGY

strategy.order("buy stop",true,stop=longDist,  oca_name="Dojy Entry",when=goStar)
strategy.order("sell stop",false,stop=shortDist, oca_name="Dojy Entry",when=goStar)

strategy.exit("exit buy","buy stop",loss=SL, profit=TP, when=Use_SL_TP)
strategy.exit("exit sell","sell stop",loss=SL,profit=TP, when=Use_SL_TP)

strategy.close("buy stop",when=not Use_SL_TP and close<dojilow)
strategy.exit("exit buy","buy stop",profit=TP, when=not Use_SL_TP)
strategy.close("sell stop",when=not Use_SL_TP and close>dojihigh)
strategy.exit("exit sell","sell stop",profit=TP, when=not Use_SL_TP)
- Supertrend Bitcoin Estrategia de línea larga
- Tendencia siguiendo la estrategia con promedios móviles y patrones de velas
- Estrategia de negociación cuantitativa basada en el breakout de la nube de Ichimoku y el índice ADX
- Estrategia de combinación de bandas de Bollinger y promedios móviles
- Estrategia de impulso del oso perezoso
- Predicción de tendencia Estrategia de media móvil doble
- Estrategia de inversión de la media móvil doble
- Estrategia de negociación de promedio móvil de doble avance
- Tendencia de los destellos deslumbrantes siguiendo la estrategia
- Estrategia VRSI y MARSI
- Tendencia de la media móvil exponencial doble siguiendo la estrategia
- Estrategia de compra/venta del saldo del DMI
- Estrategia de la media móvil desplazada
- Potencial de mercado Ichimoku Estrategia de la nube alcista
- EMA RSI Tendencia de divergencia oculta de acuerdo con la estrategia
- Estrategia avanzada de seguimiento de tendencias basada en patrones de engulfing e indicadores cuantitativos
- Estrategia de seguimiento doble de AlphaTrend
- Estrategia de detención de pesca de Yurik
- Tendencia tras la estrategia de scalping del RSI
- Estrategia de cruce en espiral con confirmación de promedio móvil