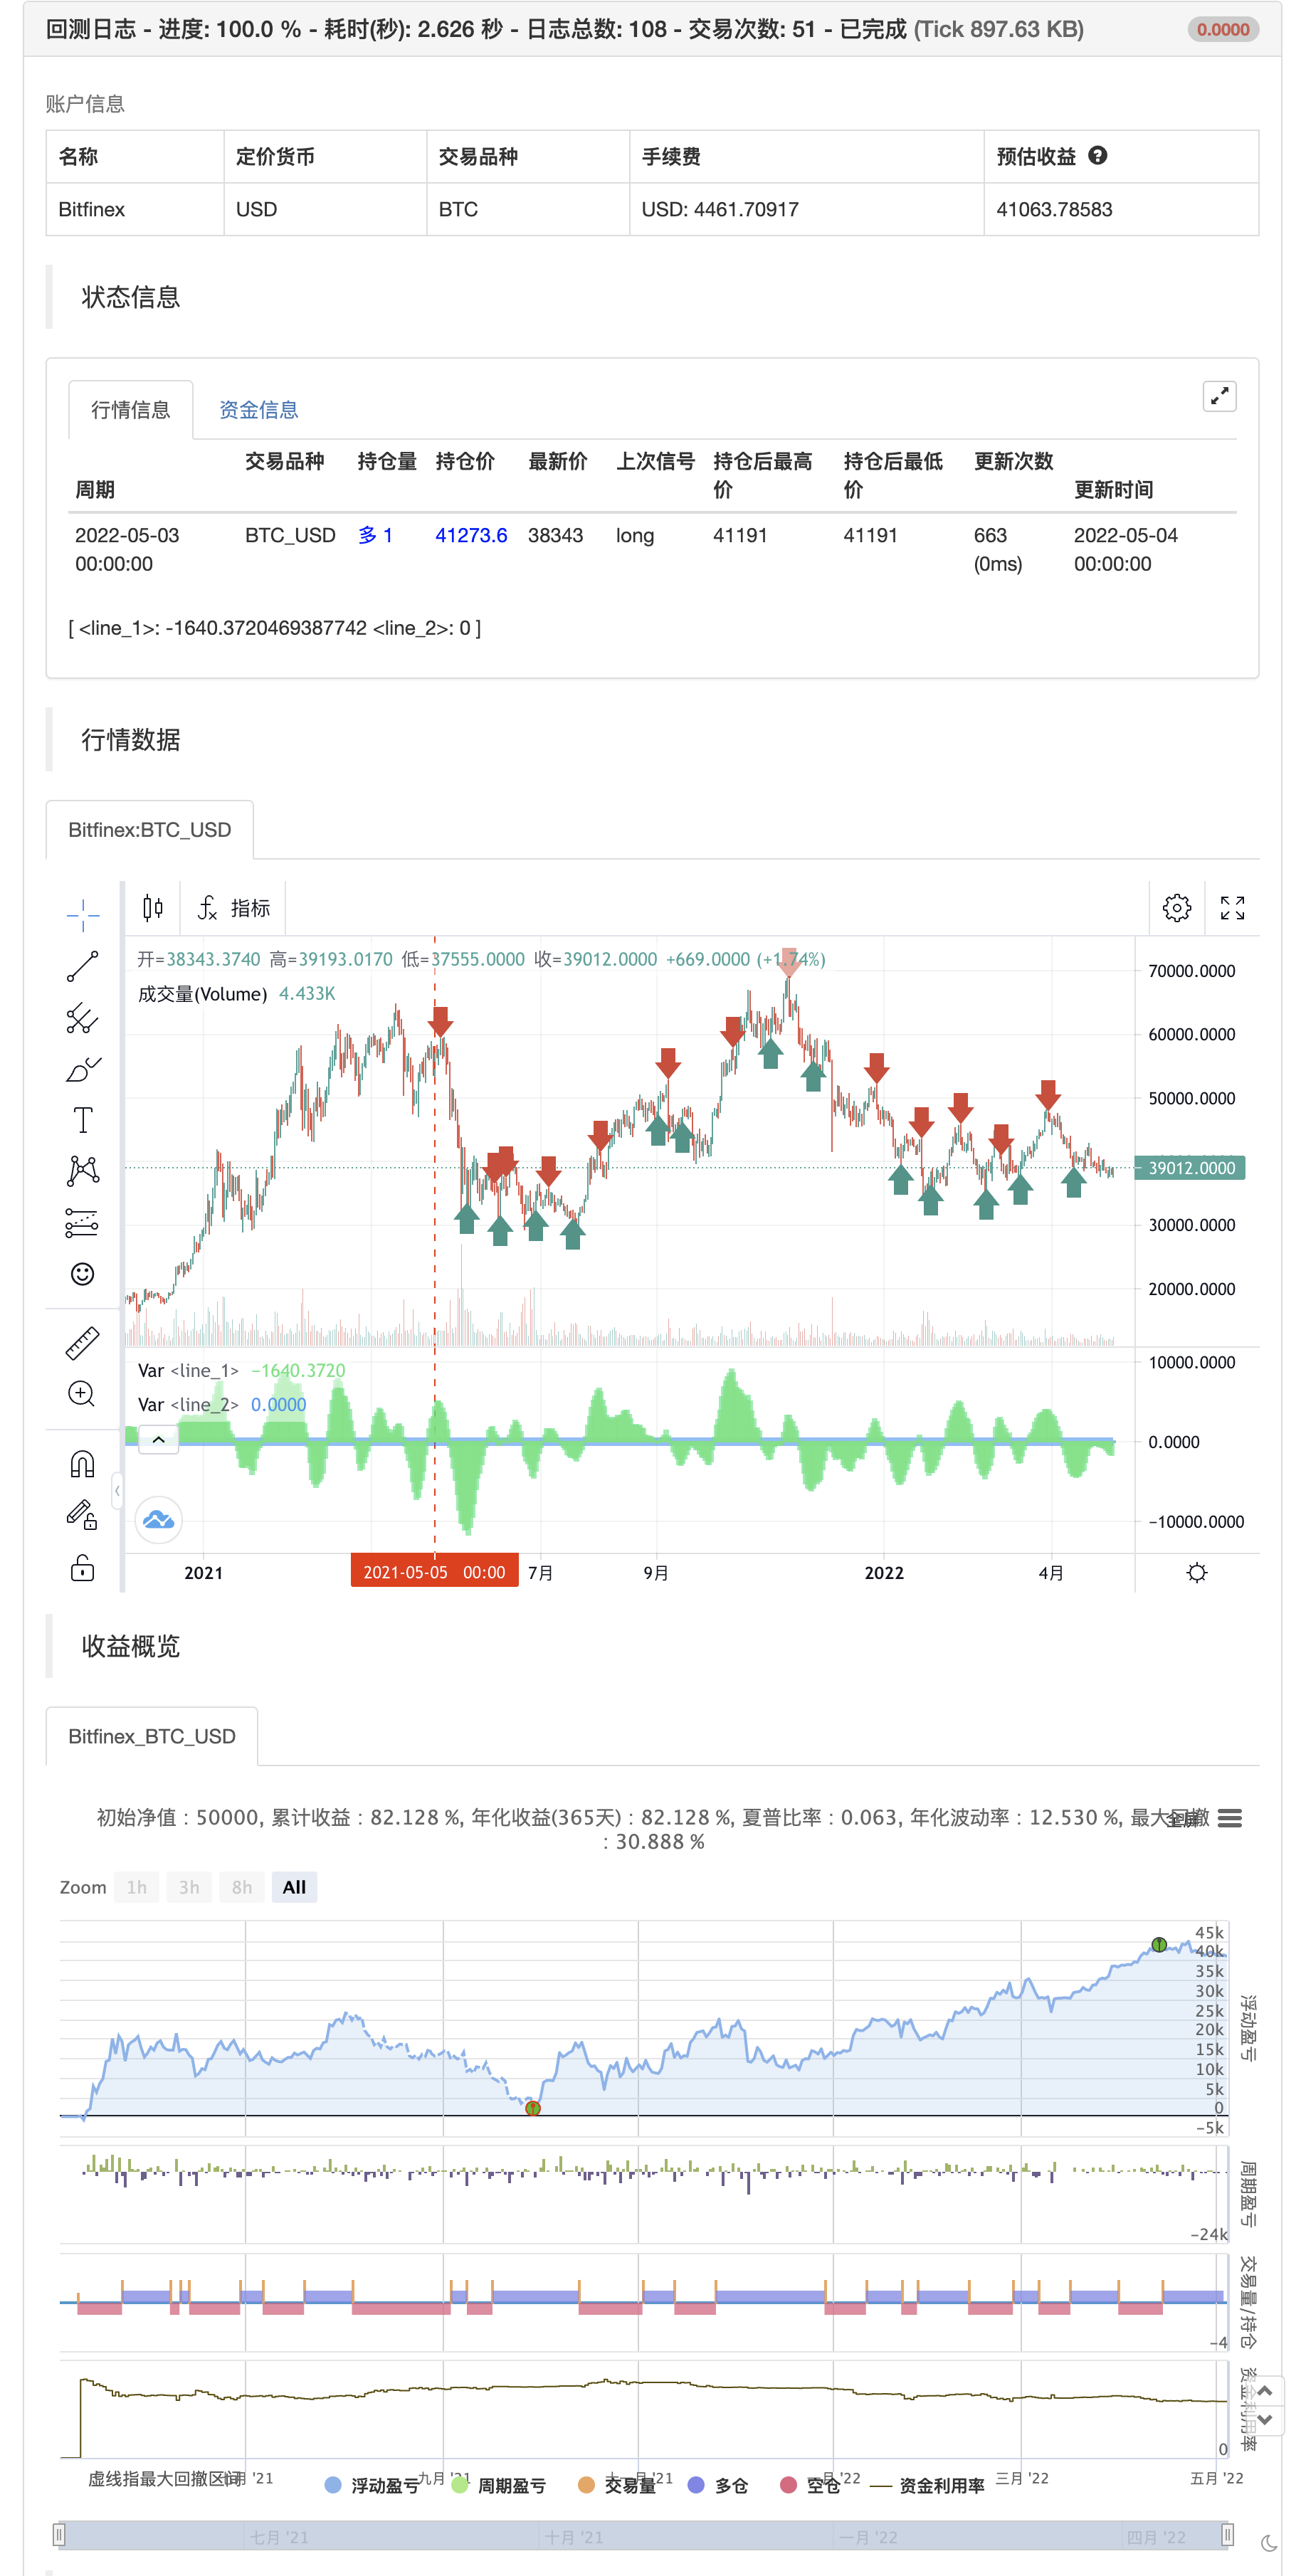
Indicateur de momentum de compression
Auteur:ChaoZhang est là., Date: 2022-05-06 17:19:10Les étiquettes:SMA
Il s'agit d'un dérivé de l'indicateur de volatilité
Les croix noires sur la ligne médiane montrent que le marché vient d'entrer dans une contraction (les bandes de Bollinger sont avec dans le canal Keltner). Cela signifie une faible volatilité, le marché se préparant à un mouvement explosif (haut ou bas). Les croix grises signifient
M.Carter suggère d'attendre le premier gris après une croix noire, et de prendre une position dans le sens de la dynamique (par exemple, si la valeur de la dynamique est supérieure à zéro, aller long). Sortir de la position lorsque la dynamique change (augmentation ou diminution
Réécriture

/*backtest
start: 2021-05-05 00:00:00
end: 2022-05-04 23:59:00
period: 1d
basePeriod: 1h
exchanges: [{"eid":"Bitfinex","currency":"BTC_USD"}]
*/

//
// @author LazyBear
// List of all my indicators: https://www.tradingview.com/v/4IneGo8h/
//
study(shorttitle = "SQZMOM_LB", title="Squeeze Momentum Indicator [LazyBear]", overlay=false)

length = input(20, title="BB Length")
mult = input(2.0,title="BB MultFactor")
lengthKC=input(14, title="KC Length")
multKC = input(1.5, title="KC MultFactor")

useTrueRange = input(true, title="Use TrueRange (KC)",defval=true)

// Calculate BB
source = close
basis = ta.sma(source, length)
dev = multKC * ta.stdev(source, length)
upperBB = basis + dev
lowerBB = basis - dev

// Calculate KC
ma = ta.sma(source, lengthKC)
range = useTrueRange ? ta.tr : (high - low)
rangema = ta.sma(range, lengthKC)
upperKC = ma + rangema * multKC
lowerKC = ma - rangema * multKC

sqzOn  = (lowerBB > lowerKC) and (upperBB < upperKC)
sqzOff = (lowerBB < lowerKC) and (upperBB > upperKC)
noSqz  = (sqzOn == false) and (sqzOff == false)

val = ta.linreg(source  -  math.avg(math.avg(ta.highest(high, lengthKC), ta.lowest(low, lengthKC)),ta.sma(close,lengthKC)),
            lengthKC,0)

bcolor = iff( val > 0,
            iff( val > nz(val[1]), color.lime, color.green),
            iff( val < nz(val[1]), color.red, color.maroon))

scolor = noSqz ? color.blue : sqzOn ? color.black : color.gray
plot(val, color=bcolor, style=plot.style_histogram, linewidth=4)
plot(0, color=scolor, style=plot.style_cross, linewidth=2)

if val >0 and val < nz(val[1])
    strategy.entry("entry short", strategy.short)
else if val <0 and val > nz(val[1])
    strategy.entry("entry long", strategy.long)
- Détermination des tendances multidimensionnelles et stratégie d'arrêt-perte dynamique ATR
- Stratégie de négociation quantitative pour s'adapter à la tendance à l'inversion de la ceinture de fer
- La tendance à l'augmentation des indicateurs confirme la stratégie de négociation
- Stratégie de négociation de tendance à signaux multiples à double équilibre RSI
- Stratégie de suivi des tendances d'adaptation et de confirmation de plusieurs transactions
- Stratégie de suivi de la tendance de la forme de la colonne d'éléphant pour une correction dynamique des pertes
- Stratégie de négociation quantifiée par paramètres dynamiques RSI à travers plusieurs lignes uniformes
- Algorithmes de négociation de l'analyse quantitative des prix à proximité K multidimensionnelle et de la forme de la chute
- Stratégie intelligente de suivi des pertes basée sur les moyennes mobiles et les modes journaliers
- Système de commutation dynamique multi-stratégique adaptatif: stratégie de négociation quantitative pour suivre les tendances de convergence et les perturbations de la plage
- Des stratégies de quantification avancées croisent des tendances multidimensionnelles et de multiples indicateurs
- Une stratégie de super-tendance
- TMA surchargée
- La stratégie MACD + SMA 200
- Système de tir à la fronde CM
- Bollinger + RSI, stratégie double v1.1
- Stratégie des bandes de Bollinger
- Traqueur de tendance optimisé
- Retours mensuels dans les stratégies PineScript
- ADX et DI pour v4
- MacD Indicateur personnalisé - Cadre de temps multiples + Toutes les options disponibles!
- Indicateur: oscillateur de tendance d'onde
- AlphaTrend
- Les échanges à l'équilibre entre les cycles
- Oscillateur de sentiment
- Le Bitcoin et le Bitcoin sont des paires de devises en liquide utilisées pour la liquidation du marché.
- Loi sur le commerce de la plage
- Prends ta tendance
- AlphaTrend utilisation de la méthode
- Une nouvelle stratégie de vol de crypto-monnaie (enseignement)
- Le MACD Pine est une stratégie simple