Indicateur de déviation de tendance K-line combiné à une stratégie de vague moyenne mobile

Aperçu
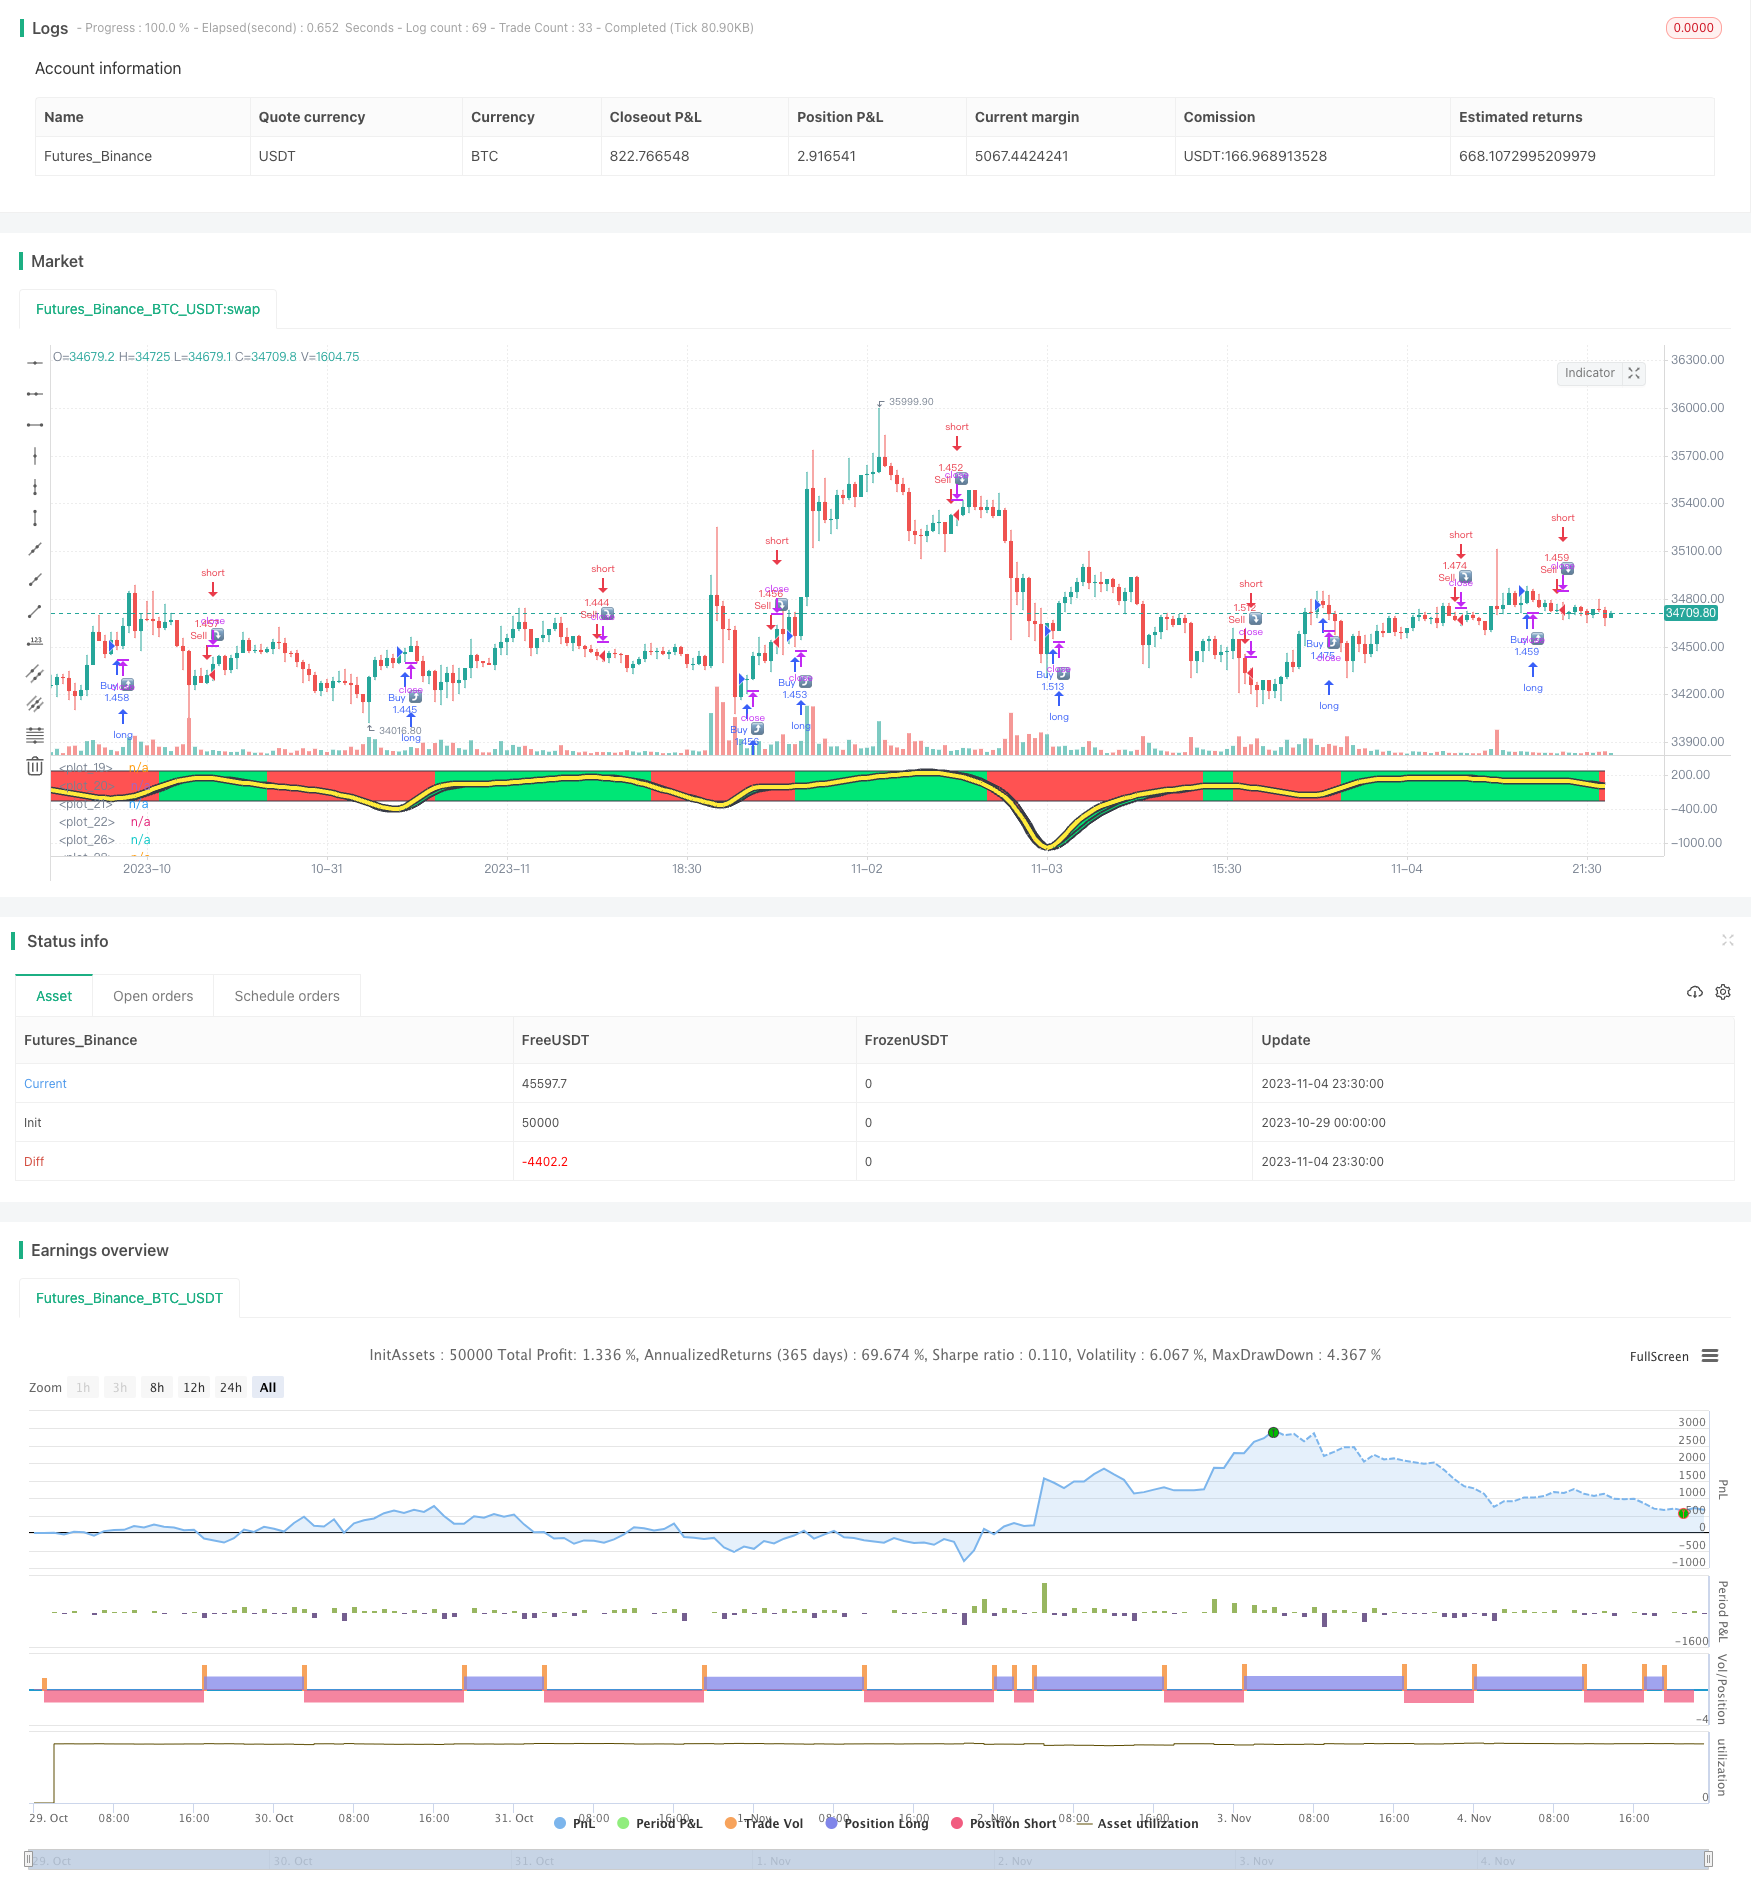
Cette stratégie consiste à calculer la tendance des prix à s’écarter de l’indicateur TSI, puis à traiter l’indicateur TSI en moyenne mobile. La direction de la ligne K combinée aux prix permet de déterminer si le cours actuel de l’action est en hausse ou en baisse, ce qui génère des signaux d’achat et de vente.
Le principe
La stratégie est principalement composée de plusieurs étapes:
- Calculer la variation du prix pct
- Le double traitement de l’HMA sur le pct donne un double_smoothed_pc
- Calculer le double HMA de la valeur absolue de pct, obtenu par double_smoothed_abs_pc
- Calculer la valeur du TSI:*(double_smoothed_pc / double_smoothed_abs_pc))
- La valeur du TSI est traitée comme une moyenne mobile HMA, qui donne la moyenne mobile tsihmaline du TSI.
- Comparer la relation entre les valeurs du TSI et les moyennes mobiles du TSI, avec une tendance à la hausse lorsque la valeur du TSI est supérieure à la moyenne mobile et une tendance à la baisse lorsque la valeur du TSI est inférieure à la moyenne mobile
- Si le prix est en hausse pendant la tendance haussière, cela génère un signal d’achat
- Dans une tendance à la baisse, un signal de vente est généré si le prix baisse également
Les étapes ci-dessus permettent de déterminer la direction de la tendance générale actuelle, combinée à l’évolution réelle des prix, pour générer un signal de transaction.
Les avantages
- Double traitement de lissage HMA pour filtrer efficacement le bruit à court terme et pour localiser les principales tendances
- Le TSI, combiné à sa moyenne mobile, permet de juger de la direction de la tendance générale
- Combinaison de la direction de la ligne K du prix, pour éviter les fausses ruptures et améliorer la fiabilité du signal
- Les paramètres sont réglables, les paramètres de lissage peuvent être ajustés en fonction du marché pour s’adapter à différents cycles
- Le graphique est intuitif, le vert pour la tendance à la hausse, le rouge pour la tendance à la baisse.
Les risques
- Les tremblements de terre produisent plusieurs signaux erronés.
- Les moyennes mobiles sont en retard à un point de basculement de la tendance et risquent de manquer le meilleur point d’entrée.
- Paramètres à ajuster fréquemment pour s’adapter aux changements du marché
- Cette stratégie est basée sur un seul indicateur TSI et peut être optimisée avec d’autres indices
Direction d’optimisation
- Les filtres peuvent être ajoutés pour éviter les signaux erronés des tremblements de terre
- D’autres indicateurs peuvent être ajoutés pour confirmer le point de basculement de la tendance
- Les paramètres peuvent être optimisés automatiquement par des méthodes telles que l’apprentissage automatique
- La stratégie de stop loss peut être introduite pour contrôler les pertes individuelles.
Résumer
Cette stratégie utilise l’indicateur TSI pour déterminer la direction de la tendance et, combinée à la ligne K du prix, génère un signal de négociation qui permet de capturer efficacement la tendance, d’acheter dans la tendance à la hausse et de vendre dans la tendance à la baisse. Cependant, il existe un certain risque qui doit être optimisé pour améliorer la stabilité.
/*backtest
start: 2023-10-29 00:00:00
end: 2023-11-05 00:00:00
period: 30m
basePeriod: 15m
exchanges: [{"eid":"Futures_Binance","currency":"BTC_USDT"}]
*/

//@version=4
strategy(title="TSIHULLBOT", shorttitle="TSICCIHULL", default_qty_type=strategy.percent_of_equity, default_qty_value=100)
long = input(title="Long Length", type=input.integer, defval=50)
short = input(title="Short Length", type=input.integer, defval=50)
signal = input(title="Signal Length", type=input.integer, defval=7)
price = input(title="Source",type=input.source,defval=open)
lineupper = input(title="Upper Line", type=input.integer, defval=250)
linelower = input(title="Lower Line", type=input.integer, defval=-250)
double_smooth(price, long, short) =>
    fist_smooth = hma(price, long)
    hma(fist_smooth, short)
pc = change(price)
double_smoothed_pc = double_smooth(pc, long, short)
double_smoothed_abs_pc = double_smooth(abs(pc), long, short)
tsi_value = (100 * (double_smoothed_pc / double_smoothed_abs_pc))*5
tsihmaline=(hma(tsi_value,signal))*5
clr = tsihmaline < tsi_value ? color.red : color.lime
clr2 = tsi_value < tsi_value[1] ? color.red : color.lime
i1=plot(lineupper+3, color=color.black, linewidth=3)
i2=plot(linelower+3, color=color.black, linewidth=3)
i3=plot(lineupper, color=clr)
i4=plot(linelower, color=clr)
trendv=tsihmaline/5.6
plot(trendv, linewidth=7,  color=color.black)
plot(trendv, linewidth=4,  color=color.yellow)
j1=plot(tsi_value, linewidth=5, color=color.black)
j2=plot(tsi_value[1], linewidth=5, color=color.black)
j3=plot(tsi_value, color=clr2)
j4=plot(tsi_value[1], color=clr2)
fill(i3,i4,color=clr,transp=90)
fill(j3,j4,color=clr2,transp=15)
longCondition = tsihmaline>tsihmaline[1] and price>price[1]
if (longCondition)
    strategy.entry("Buy ⤴️", strategy.long)
shortCondition = tsihmaline<tsihmaline[1] and price<price[1]
if (shortCondition)
    strategy.entry("Sell ⤵️", strategy.short)