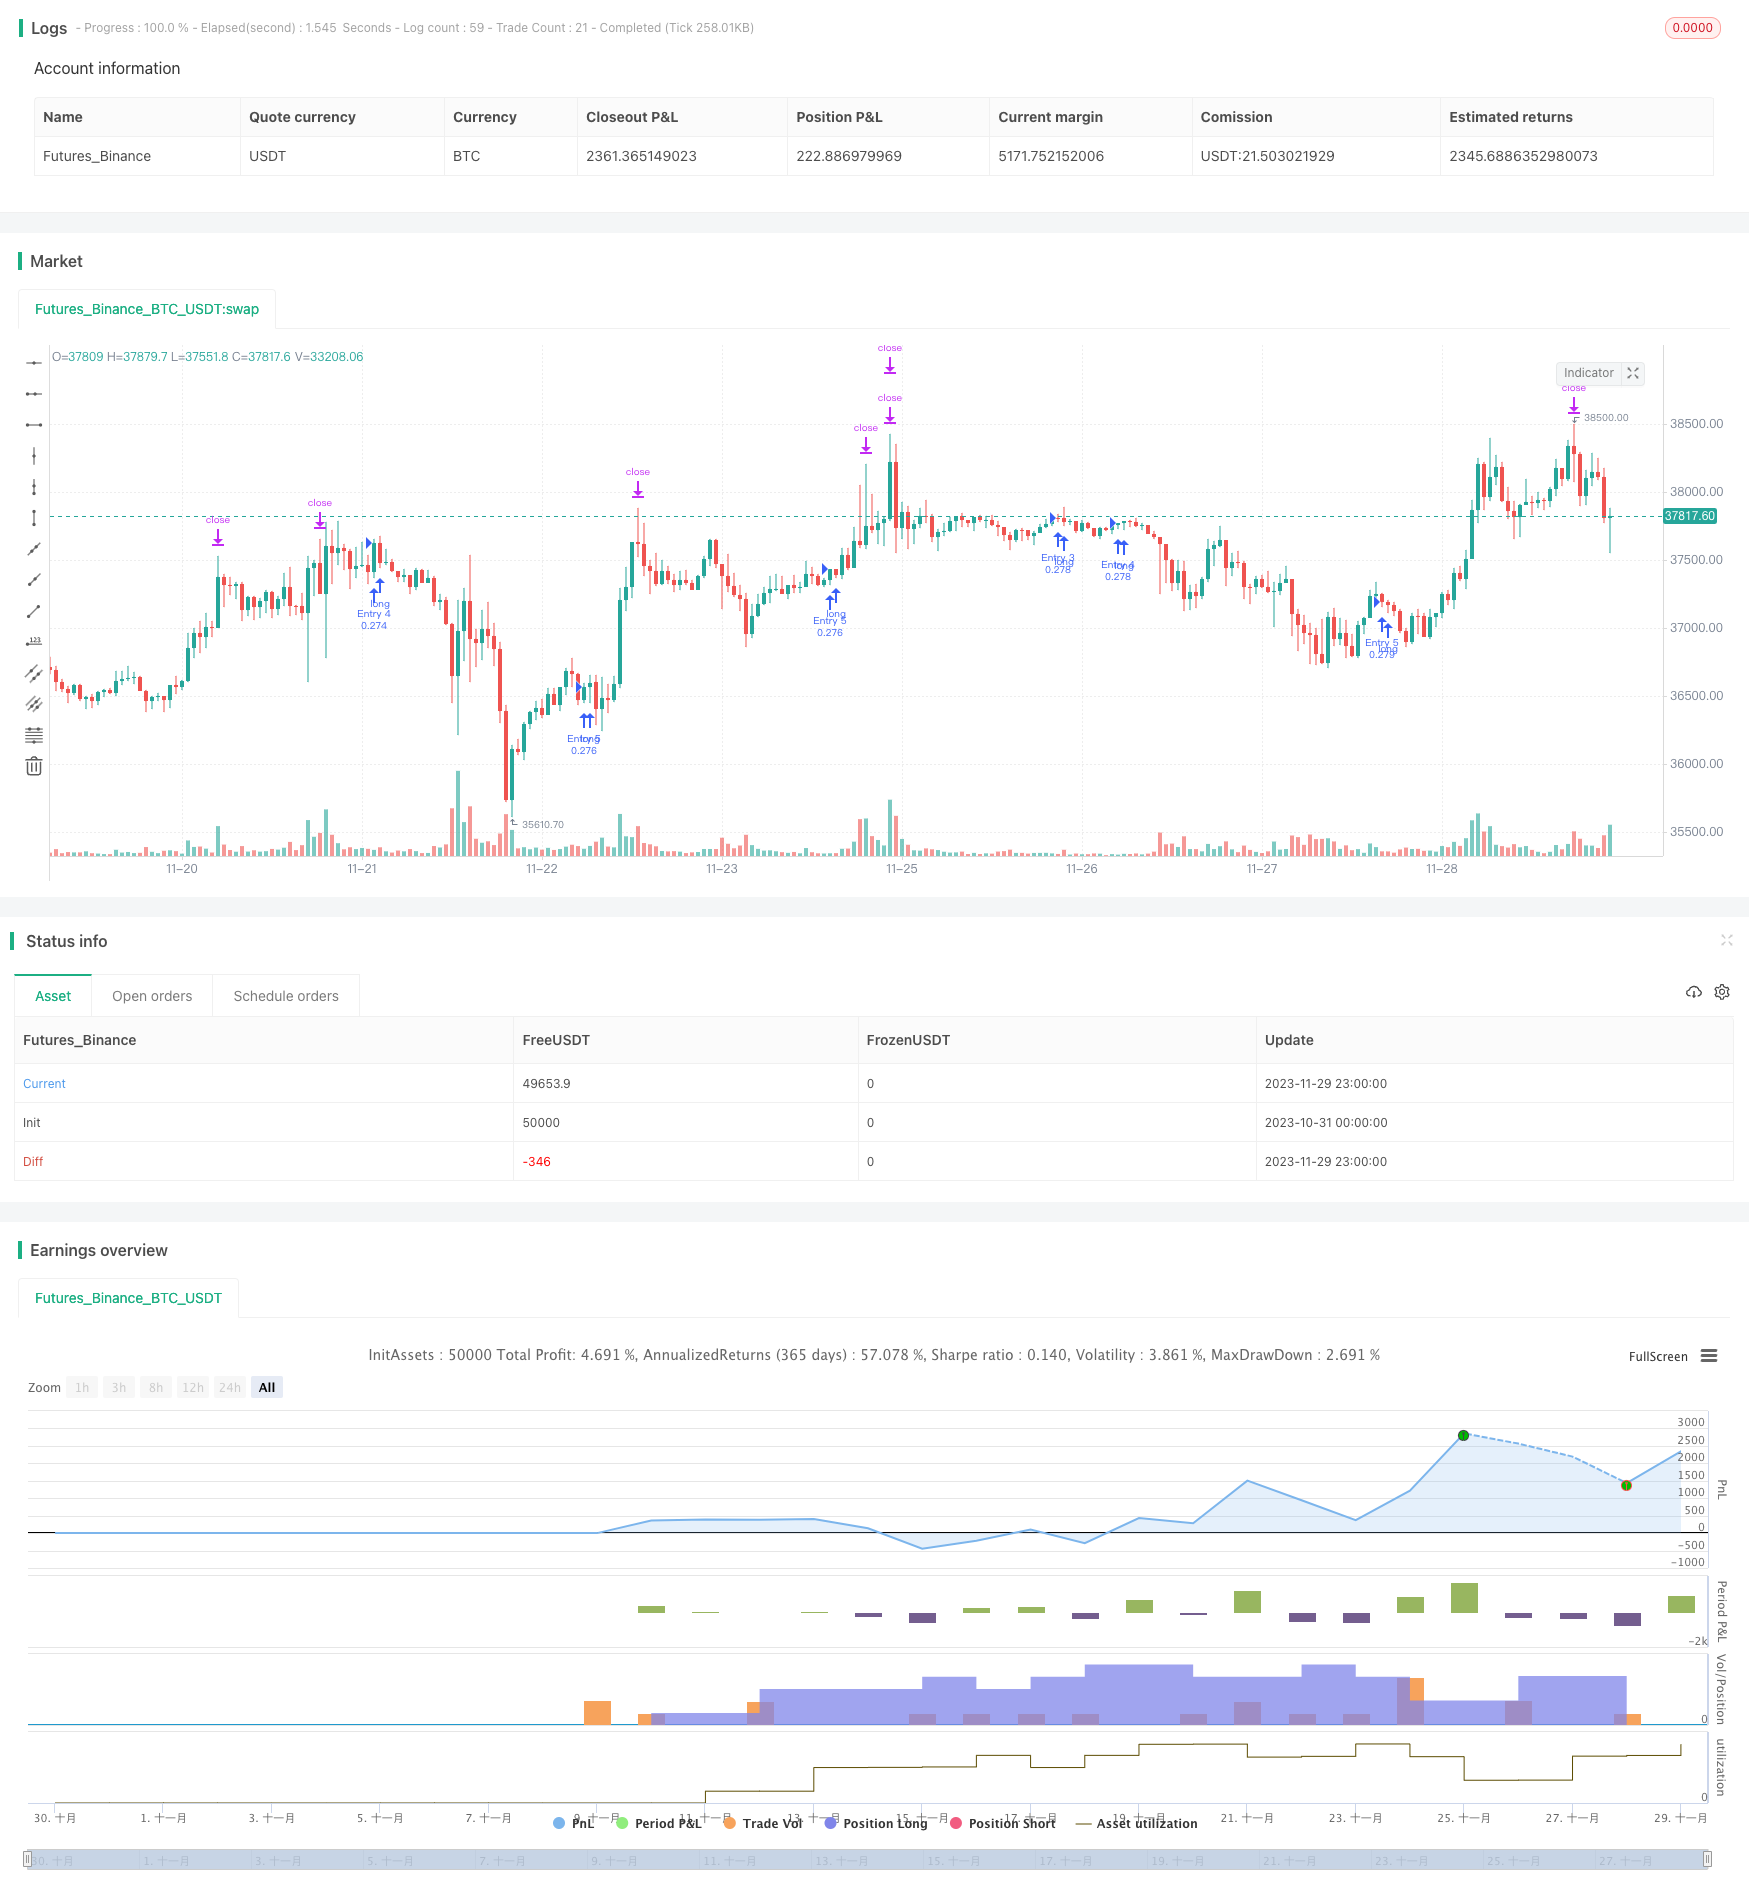
Stratégie de négociation quantitative de Bitcoin basée sur plusieurs délais
Auteur:ChaoZhang est là., Date: 2023-12-01 13:50:02 Je vous en prie.Les étiquettes:

Résumé
Cette stratégie identifie les bandes de prix du Bitcoin en combinant des indicateurs quantitatifs sur différentes périodes et en effectuant des transactions de suivi des tendances.
La logique de la stratégie
- L'indicateur RSI calculé sur la base de la période quotidienne est pondéré sur la base du volume des transactions afin de filtrer les fausses ruptures.
- L'indicateur quotidien RSI est aplani par une EMA pour construire un indicateur quantitatif de bande.
- Le délai de 5 minutes utilise une combinaison d'indicateurs de régression linéaire et d'HMA pour générer des signaux de négociation.
- En combinant l'indicateur quantitatif des bandes et les signaux de négociation sur des périodes différentes, la stratégie identifie les bandes de prix à moyen et à long terme.
Analyse des avantages
- L'indicateur RSI pondéré par volume peut identifier efficacement les vraies bandes et filtrer les fausses ruptures.
- L'indicateur HMA est plus sensible aux variations de prix et peut capturer les tours en temps opportun.
- La combinaison de plusieurs délais permet une identification plus précise des bandes à moyen et long terme.
- La négociation sur la période de 5 minutes permet une fréquence d'opération plus élevée.
- En tant que stratégie de suivi de bande, elle ne nécessite pas de choix précis des points et peut durer plus longtemps.
Analyse des risques
- Les indicateurs quantitatifs peuvent générer de faux signaux, l'analyse fondamentale est recommandée.
- Les bandes peuvent voir des retours à mi-chemin, des mécanismes de stop-loss devraient être en place.
- Les retards de signal peuvent entraîner une absence des meilleurs points d'entrée.
- Les bandes rentables nécessitent des périodes de détention plus longues, ce qui exige une tolérance à la pression des capitaux.
Directions d'optimisation
- Évaluation de l'efficacité des indicateurs RSI avec différents paramètres.
- Essayez d'introduire d'autres indicateurs de bande auxiliaire.
- Optimiser les paramètres de longueur des indicateurs HMA.
- Ajoutez des stratégies de stop loss et de profit.
- Ajustez le cycle de rétention pour les échanges de bandes.
Conclusion
Cette stratégie capture efficacement les tendances à moyen et long terme du Bitcoin en couplant les délais et le suivi des bandes.
/*backtest
start: 2023-10-31 00:00:00
end: 2023-11-30 00:00:00
period: 1h
basePeriod: 15m
exchanges: [{"eid":"Futures_Binance","currency":"BTC_USDT"}]
*/

//@version=4

strategy(title='Pyramiding BTC 5 min', overlay=true, pyramiding=5, initial_capital=10000, default_qty_type=strategy.percent_of_equity, default_qty_value=20, commission_type=strategy.commission.percent, commission_value=0.075)
//the pyramide based on this script  https://www.tradingview.com/script/7NNJ0sXB-Pyramiding-Entries-On-Early-Trends-by-Coinrule/
//
fastLength = input(250, title="Fast filter length ", minval=1)
slowLength = input(500,title="Slow filter length",  minval=1)
source=close
v1=ema(source,fastLength)
v2=ema(source,slowLength)
//
//Backtest dates
fromMonth = input(defval=1, title="From Month")
fromDay = input(defval=10, title="From Day")
fromYear = input(defval=2020, title="From Year")
thruMonth = input(defval=1, title="Thru Month")
thruDay = input(defval=1, title="Thru Day")
thruYear = input(defval=2112, title="Thru Year")

showDate = input(defval=true, title="Show Date Range")

start = timestamp(fromYear, fromMonth, fromDay, 00, 00)  // backtest start window
finish = timestamp(thruYear, thruMonth, thruDay, 23, 59)  // backtest finish window
window() =>  // create function "within window of time"
    time >= start and time <= finish ? true : false


leng=1
p1=close[1]

len55 = 10
//taken from https://www.tradingview.com/script/Ql1FjjfX-security-free-MTF-example-JD/
HTF = input("1D", type=input.resolution)
ti = change( time(HTF) ) != 0
T_c = fixnan( ti ? close : na )

vrsi = rsi(cum(change(T_c) * volume), leng)
pp=wma(vrsi,len55)

d=(vrsi[1]-pp[1])
len100 = 10
x=ema(d,len100)
//
zx=x/-1
col=zx > 0? color.lime : color.orange

//

tf10 = input("1", title = "Timeframe", type = input.resolution, options = ["1", "5", "15", "30", "60","120", "240","360","720", "D", "W"])

length = input(50, title = "Period", type = input.integer)
shift = input(1, title = "Shift", type = input.integer)

hma(_src, _length)=>
    wma((2 * wma(_src, _length / 2)) - wma(_src, _length), round(sqrt(_length)))

hma3(_src, _length)=>
    p = length/2
    wma(wma(close,p/3)*3 - wma(close,p/2) - wma(close,p),p)

b =security(syminfo.tickerid, tf10, hma3(close[1], length)[shift])
//plot(a,color=color.gray)
//plot(b,color=color.yellow)
close_price = close[0]
len = input(25)

linear_reg = linreg(close_price, len, 0)


filter=input(true)

buy=crossover(linear_reg, b)

longsignal = (v1 > v2 or filter == false ) and buy and window()

//set take profit

ProfitTarget_Percent = input(3)
Profit_Ticks = close * (ProfitTarget_Percent / 100) / syminfo.mintick

//set take profit

LossTarget_Percent = input(10)
Loss_Ticks = close * (LossTarget_Percent / 100) / syminfo.mintick


//Order Placing

strategy.entry("Entry 1", strategy.long, when=strategy.opentrades == 0 and longsignal)

strategy.entry("Entry 2", strategy.long, when=strategy.opentrades == 1 and longsignal)

strategy.entry("Entry 3", strategy.long, when=strategy.opentrades == 2 and longsignal)

strategy.entry("Entry 4", strategy.long, when=strategy.opentrades == 3 and longsignal)

strategy.entry("Entry 5", strategy.long, when=strategy.opentrades == 4 and longsignal)


if strategy.position_size > 0
    strategy.exit(id="Exit 1", from_entry="Entry 1", profit=Profit_Ticks, loss=Loss_Ticks)
    strategy.exit(id="Exit 2", from_entry="Entry 2", profit=Profit_Ticks, loss=Loss_Ticks)
    strategy.exit(id="Exit 3", from_entry="Entry 3", profit=Profit_Ticks, loss=Loss_Ticks)
    strategy.exit(id="Exit 4", from_entry="Entry 4", profit=Profit_Ticks, loss=Loss_Ticks)
    strategy.exit(id="Exit 5", from_entry="Entry 5", profit=Profit_Ticks, loss=Loss_Ticks)
Plus de
- La stratégie du scalping intradien en combinaison de deux indicateurs
- Stratégie de négociation dynamique en réseau
- Stratégie de négociation à moyenne mobile double
- Stratégie de sortie de la cloche d'ouverture de la moyenne mobile de prise de bénéfices précoce
- Stratégie de rupture parabolique mensuelle
- Stratégie quantitative croisée de filtrage de tendance moyenne mobile
- RSI et stratégie de négociation quantitative basée sur la moyenne mobile
- La stratégie RSI-Bollinger Band pour la capture de la volatilité
- Stratégie quantitative de la triade inverse
- Stratégie d' ondes FiboBuLL basée sur la rupture des bandes de Bollinger
- Tendance à suivre la stratégie de la moyenne mobile exponentielle
- Stratégie d'inversion des pertes par arrêt de traîneau
- Stratégie d'inversion rapide du RSI
- La valeur de l'échange est la valeur de l'échange de la valeur de l'échange de l'échange.
- Stratégie de tendance croisée de la moyenne mobile du RSI
- Stratégie dynamique de soutien et de résistance basée sur des données historiques
- La stratégie de suivi de Bollinger de Noro
- Stratégie d'achat-vente inversée de l'EMA
- Stratégie de prix de clôture de Harami
- Stratégie de négociation dynamique basée sur l'OCM et l'AMM