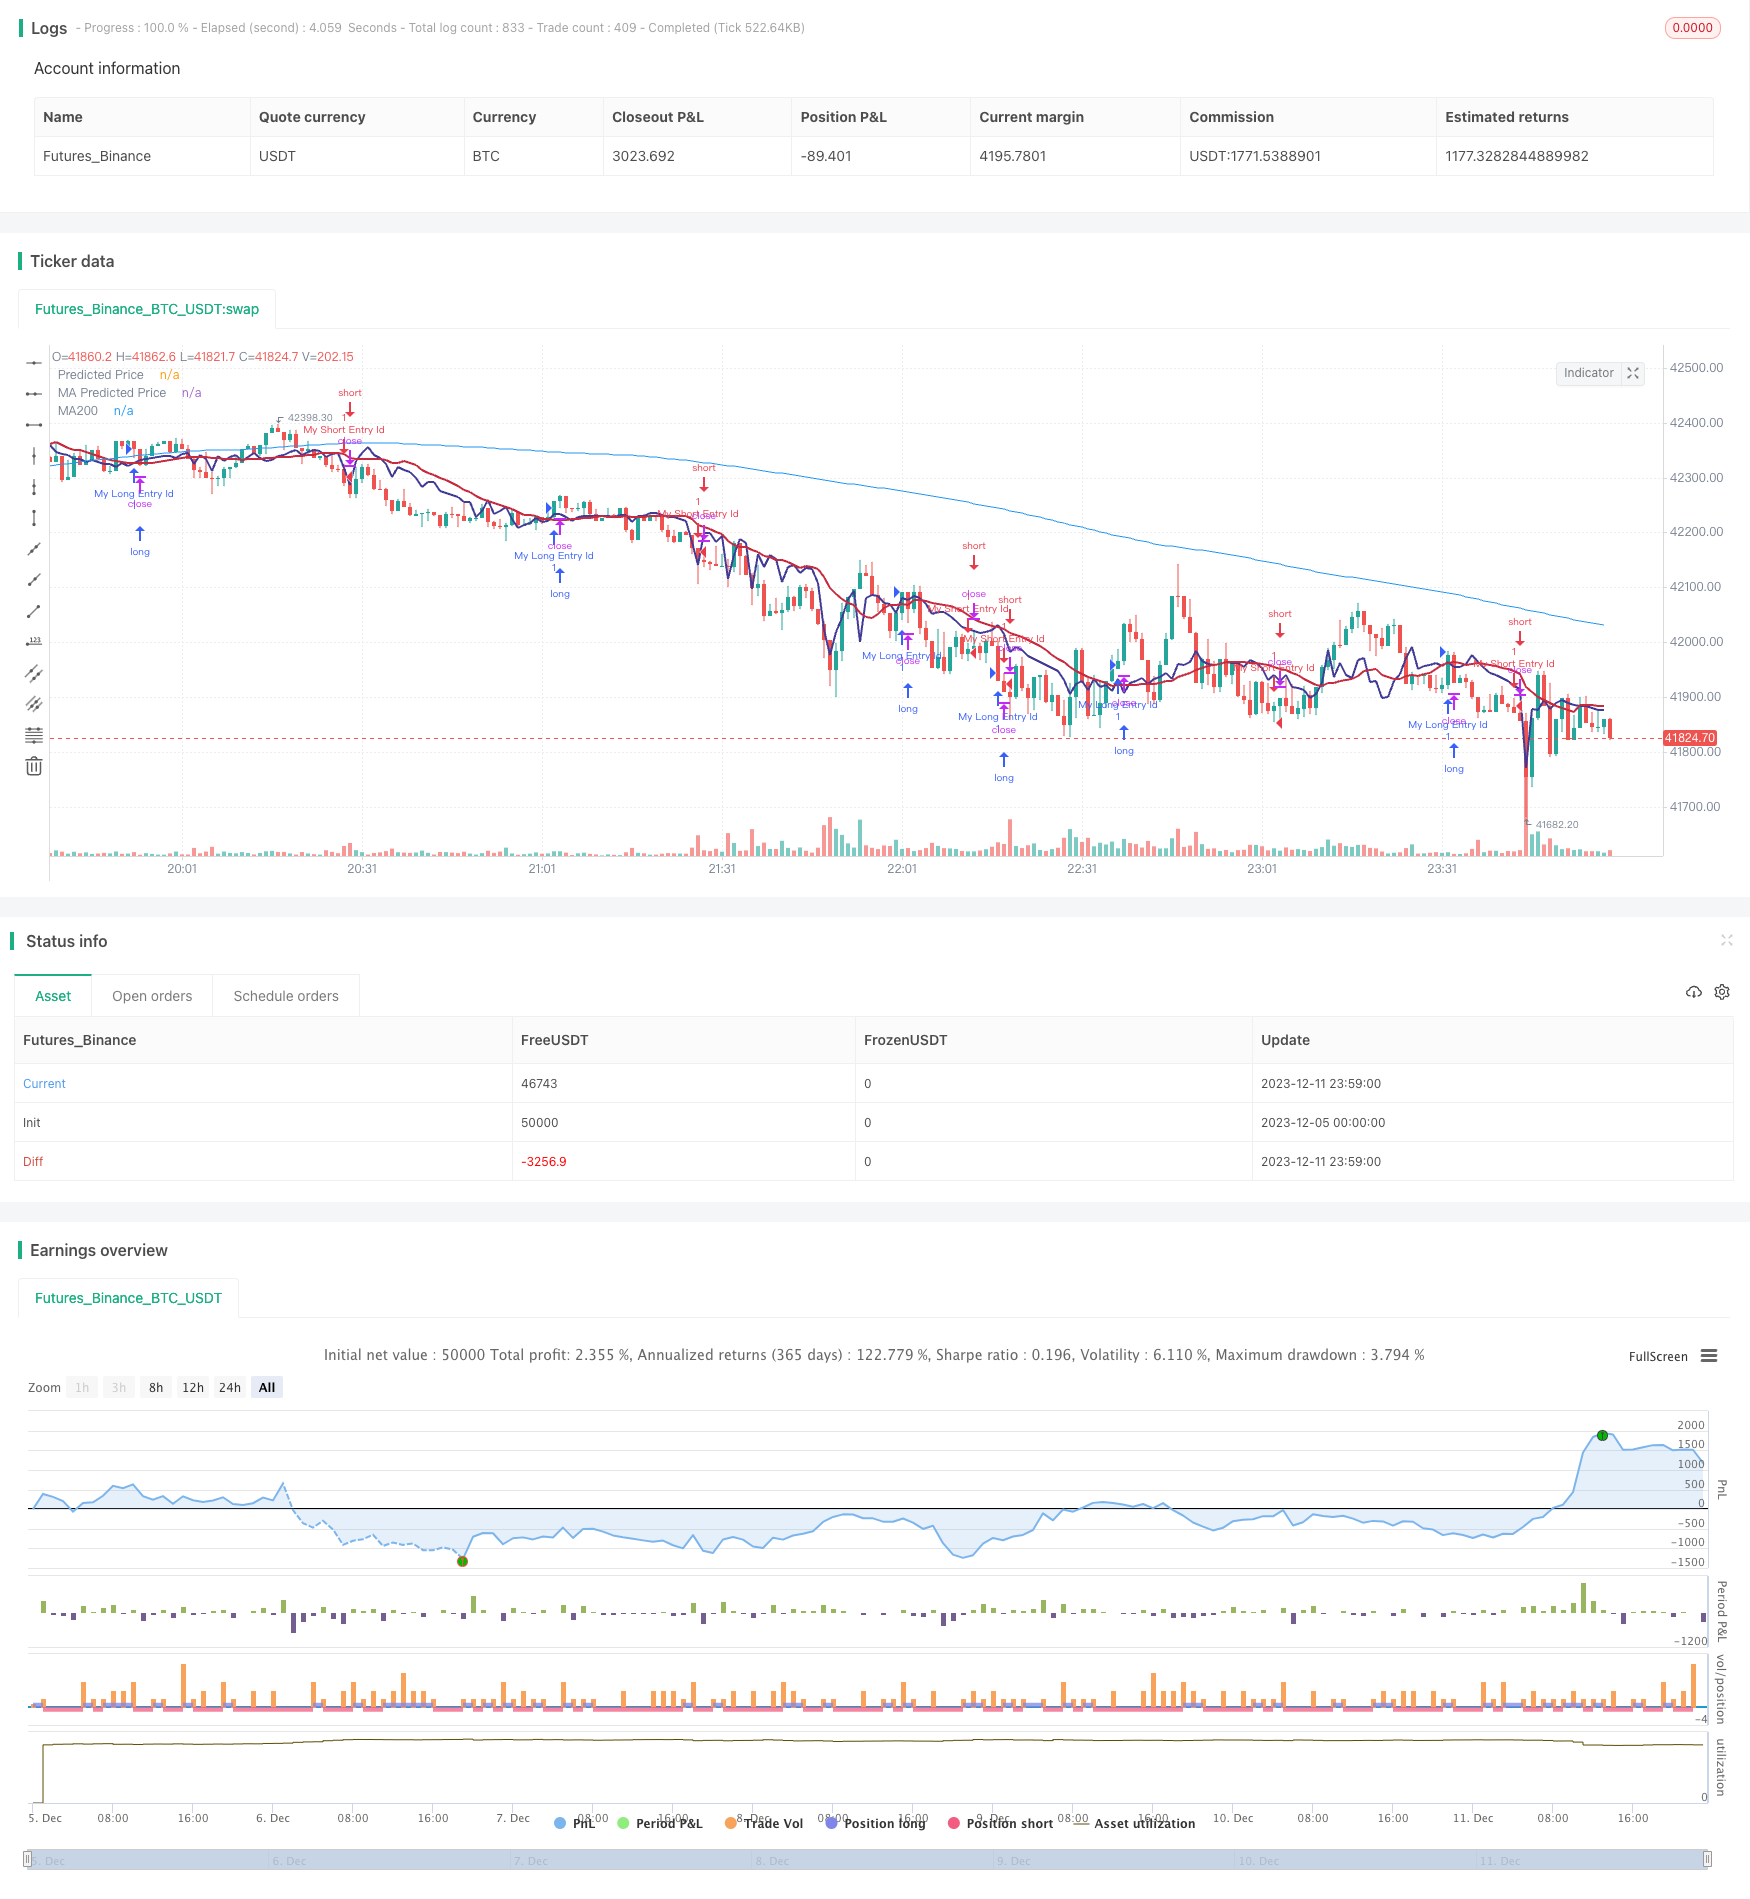
Stratégie de renversement de tendance idéologique dynamique

Aperçu
La stratégie de renversement de tendance idéologique dynamique utilise la régression linéaire pour prédire le prix et la génération de signaux de transaction associés à l’idéologie formée par les moyennes mobiles. Elle génère un signal d’achat lorsque le prix prévu traverse la moyenne mobile de bas en haut; elle génère un signal de vente lorsque le prix prévu traverse la moyenne mobile de haut en bas, permettant de capturer le renversement de tendance.
Principe de stratégie
- La régression linéaire du prix d’une action calculée sur la base du volume des transactions donne la valeur prévue du prix.
- Calculer une moyenne mobile dans des conditions différentes
- Un signal d’achat est généré lorsque le prix prévu traverse la moyenne mobile de bas en haut.
- Le signal de vente est généré lorsque le prix prévu traverse la moyenne mobile de haut en bas.
- Le moment de l’inversion de tendance combiné avec l’indicateur MACD
Les signaux ci-dessus combinent plusieurs types de confirmation pour éviter les fausses percées, ce qui améliore l’exactitude du signal.
Analyse des avantages
- L’utilisation de la régression linéaire pour prédire les tendances des prix et améliorer la précision des signaux
- L’idée est que les moyennes mobiles, combinées à l’idéologie, captent l’inversion de tendance.
- La régression linéaire basée sur le volume des transactions est plus économique
- La combinaison d’indicateurs tels que MACD pour la confirmation multiple réduit les faux signaux
Analyse des risques
- La régulation des paramètres de la régression linéaire a une grande influence sur les résultats.
- Les paramètres des moyennes mobiles affectent également la qualité du signal
- Le risque de faux signaux existe malgré les mécanismes de confirmation
- Le code peut être optimisé pour réduire le nombre de transactions et augmenter les taux de profit
Direction d’optimisation
- Paramètres d’optimisation de la régression linéaire et des moyennes mobiles
- Augmentation des conditions de confirmation pour réduire le taux de faux signaux
- Plus de facteurs à prendre en compte pour juger de l’inversion de la qualité
- Optimiser les stratégies de stop loss et réduire le risque de transaction unique
Résumer
L’idéologie de l’inversion de tendance intégrant la prévision de la régression linéaire et la formation d’une moyenne mobile pour capturer le moment de l’inversion de tendance. Elle a une plus grande fiabilité par rapport à un seul indicateur. De plus, la stratégie peut améliorer encore la qualité du signal et le niveau de rentabilité en ajustant les paramètres et en optimisant les conditions de confirmation.
/*backtest
start: 2023-12-05 00:00:00
end: 2023-12-12 00:00:00
period: 1m
basePeriod: 1m
exchanges: [{"eid":"Futures_Binance","currency":"BTC_USDT"}]
*/

// This source code is subject to the terms of the Mozilla Public License 2.0 at https://mozilla.org/MPL/2.0/
// © stocktechbot
//@version=5
strategy("Linear Cross", overlay=true, margin_long=100, margin_short=0)

//Linear Regression

vol = volume

// Function to calculate linear regression
linregs(y, x, len) =>
    ybar = math.sum(y, len)/len
    xbar = math.sum(x, len)/len
    b = math.sum((x - xbar)*(y - ybar),len)/math.sum((x - xbar)*(x - xbar),len)
    a = ybar - b*xbar
    [a, b]

// Historical stock price data
price = close

// Length of linear regression
len = input(defval = 21, title = 'Strategy Length')
linearlen=input(defval = 9, title = 'Linear Lookback')
[a, b] = linregs(price, vol, len)

// Calculate linear regression for stock price based on volume
//eps = request.earnings(syminfo.ticker, earnings.actual)
//MA For double confirmation

out = ta.sma(close, 200)
outf = ta.sma(close, 50)
outn = ta.sma(close, 90)
outt = ta.sma(close, 21)
outthree = ta.sma(close, 9)

// Predicted stock price based on volume
predicted_price = a + b*vol

// Check if predicted price is between open and close
is_between = open < predicted_price and predicted_price < close

//MACD
//[macdLine, signalLine, histLine] = ta.macd(close, 12, 26, 9)

// Plot predicted stock price
plot(predicted_price, color=color.rgb(65, 59, 150), linewidth=2, title="Predicted Price")
plot(ta.sma(predicted_price,linearlen), color=color.rgb(199, 43, 64), linewidth=2, title="MA Predicted Price")
//offset = input.int(title="Offset", defval=0, minval=-500, maxval=500)
plot(out, color=color.blue, title="MA200")
[macdLine, signalLine, histLine] = ta.macd(predicted_price, 12, 26, 9)

//BUY Signal

longCondition=false
mafentry =ta.sma(close, 50) > ta.sma(close, 90)
//matentry = ta.sma(close, 21) > ta.sma(close, 50)
matwohun = close > ta.sma(close, 200)
twohunraise = ta.rising(out, 2)
twentyrise = ta.rising(outt, 2)
macdrise = ta.rising(macdLine,2)
macdlong = ta.crossover(predicted_price, ta.wma(predicted_price,linearlen))  and (signalLine < macdLine)
if macdlong and macdrise
    longCondition := true

if (longCondition)
    strategy.entry("My Long Entry Id", strategy.long)
//Sell Signal
lastEntryPrice = strategy.opentrades.entry_price(strategy.opentrades - 1)
daysSinceEntry = len
daysSinceEntry := int((time - strategy.opentrades.entry_time(strategy.opentrades - 1)) / (24 * 60 * 60 * 1000))
percentageChange = (close - lastEntryPrice) / lastEntryPrice * 100
//trailChange = (ta.highest(close,daysSinceEntry) - close) / close * 100

//label.new(bar_index, high, color=color.black, textcolor=color.white,text=str.tostring(int(trailChange)))
shortCondition=false
mafexit =ta.sma(close, 50) < ta.sma(close, 90)
matexit = ta.sma(close, 21) < ta.sma(close, 50)
matwohund = close < ta.sma(close, 200)
twohunfall = ta.falling(out, 3)
twentyfall = ta.falling(outt, 2)
shortmafall = ta.falling(outthree, 1)
macdfall = ta.falling(macdLine,1)
macdsell = macdLine < signalLine
if macdfall and macdsell and (macdLine < signalLine) and ta.falling(low,2)
    shortCondition := true

if (shortCondition)
    strategy.entry("My Short Entry Id", strategy.short)