MACD linéaire Débloquez la magie de la régression linéaire dans TradingView

Nom de la stratégie: stratégie MACD linéaire basée sur la puissance
Il utilise la régression linéaire pour analyser les prix historiques et les volumes de transactions afin de prédire les tendances futures. Il utilise la régression linéaire pour déterminer le moment d’entrée en bourse lorsque des opportunités de profit se présentent.
Le principe de la stratégie:
- Calculer le coefficient de régression linéaire du prix: une ligne de régression linéaire est ajustée en fonction du volume des transactions historiques, afin de prédire le prix futur.
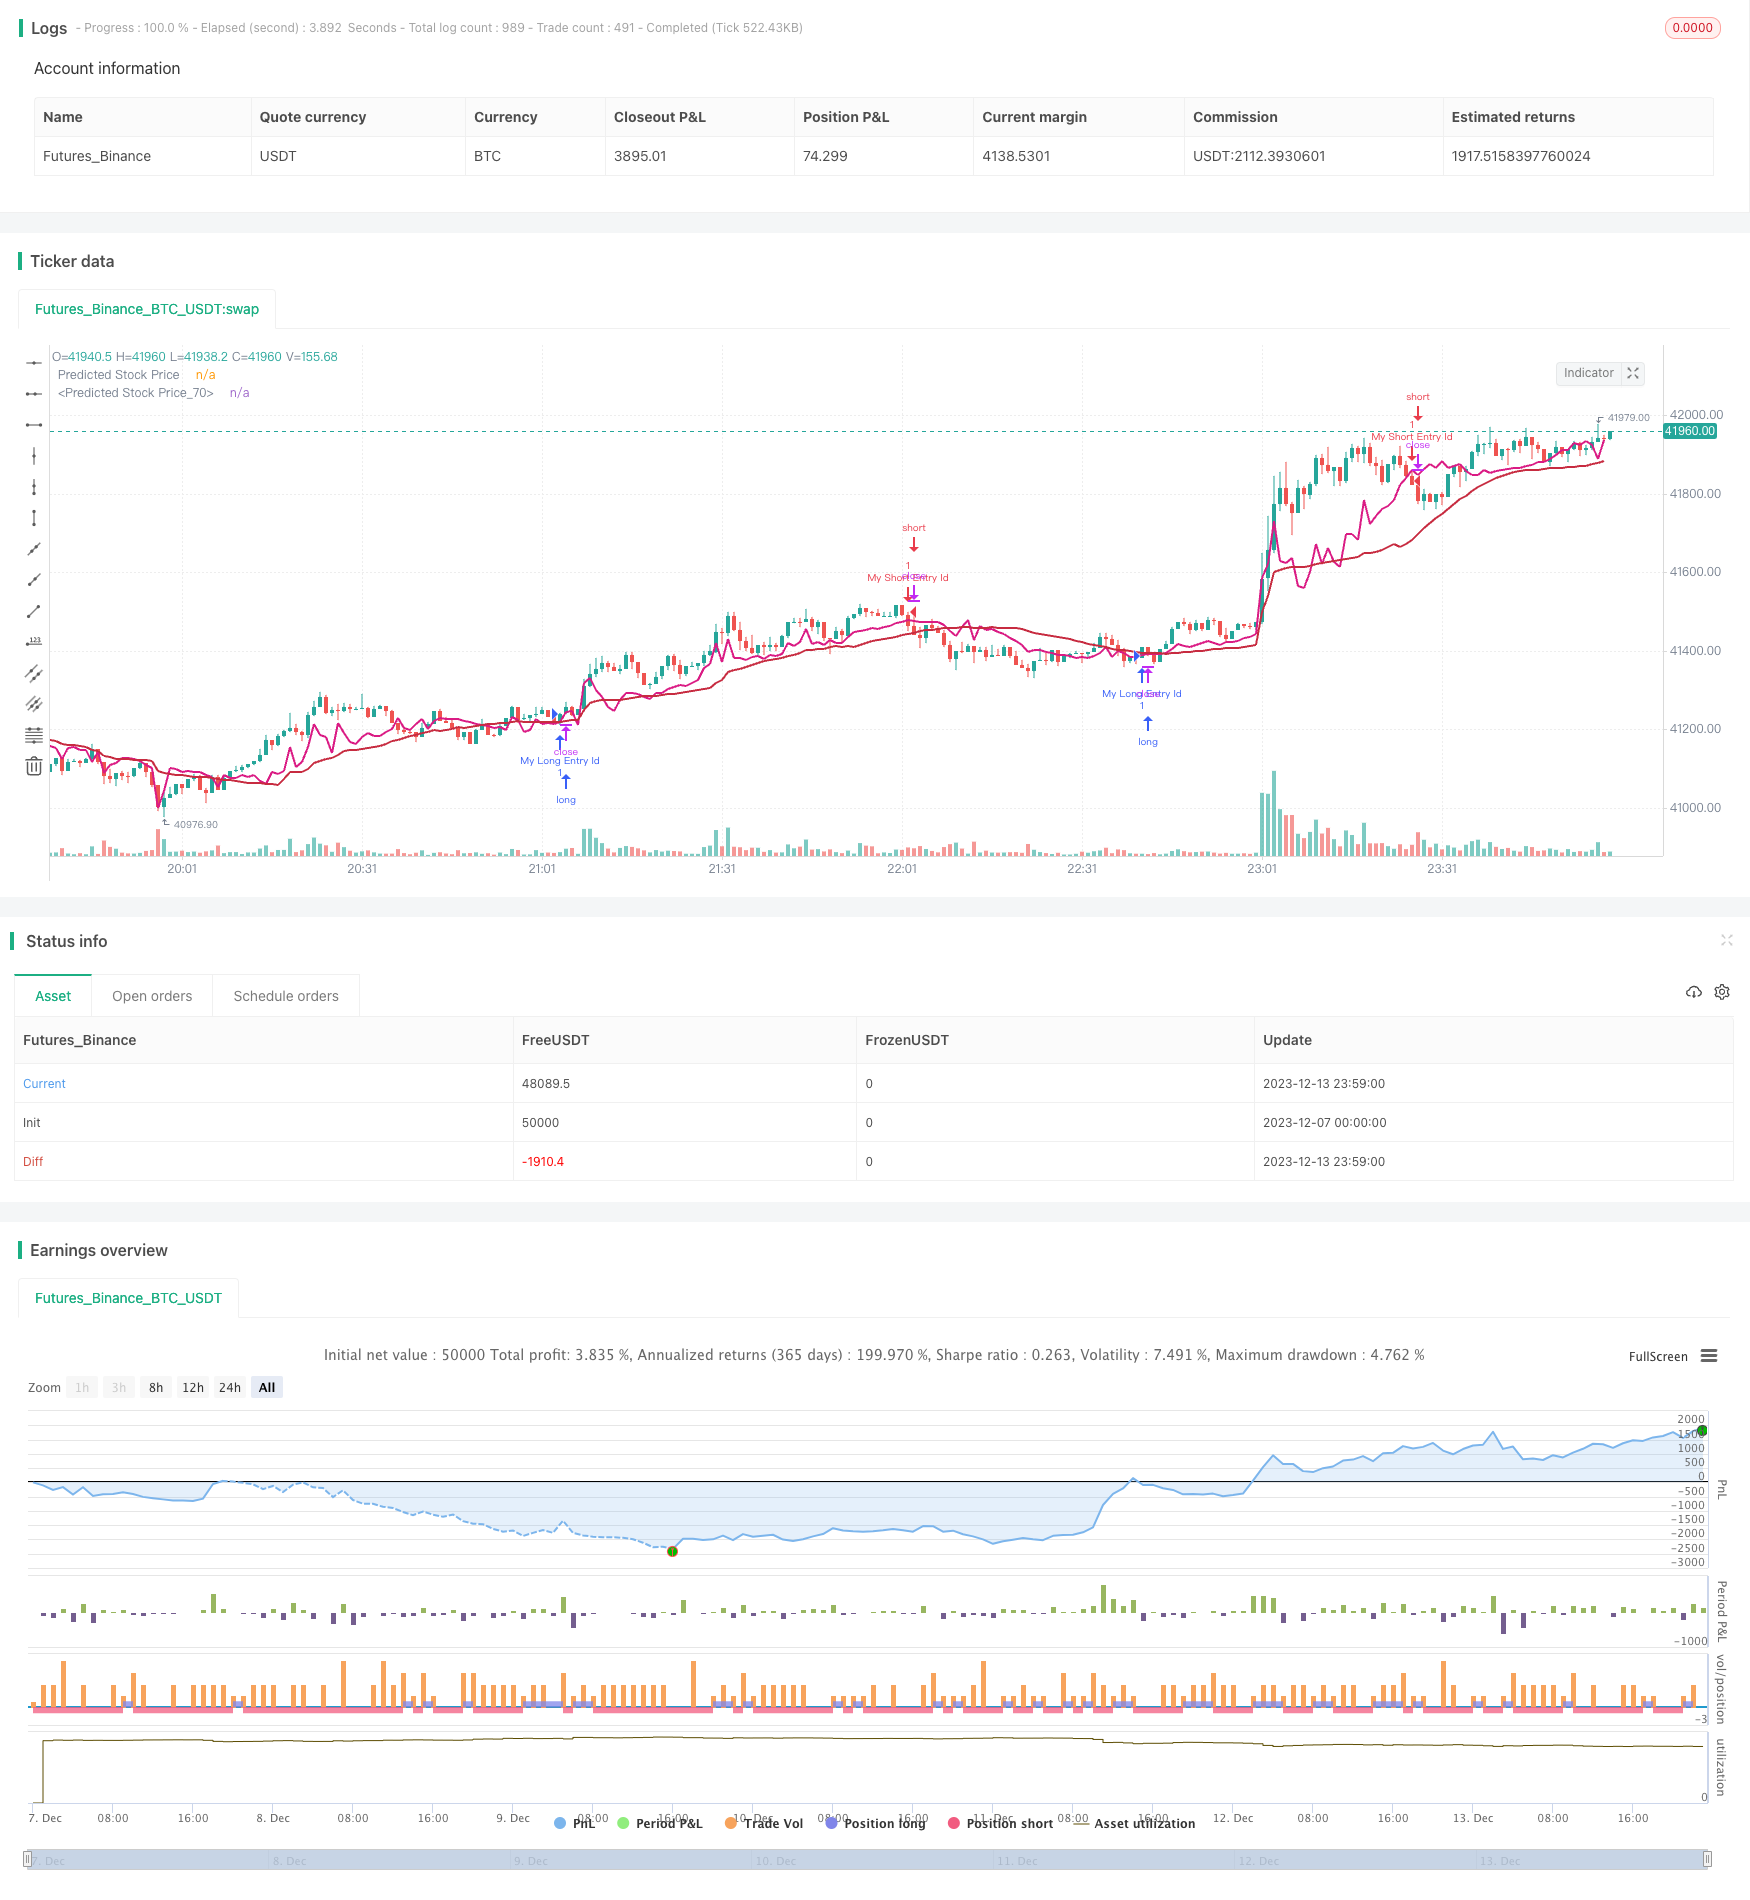
- Tracer une ligne de prévision des prix en fonction du coefficient de régression de l’étape 1
- Génération d’un signal d’achat: génération d’un signal d’achat lorsque le prix prévu se situe entre le prix d’ouverture et le prix de clôture et que le MACD augmente.
- Génération d’un signal de vente: génération d’un signal de vente lorsque le MACD baisse et que le prix est inférieur au prix prévu.
Analyse des avantages: Il s’agit d’une stratégie qui combine les prévisions statistiques et les indicateurs techniques. Il utilise la régression linéaire pour faire des prévisions de prix et éviter les spéculations subjectives. Dans le même temps, l’indicateur MACD permet de déterminer efficacement le cours du marché et de saisir les opportunités avec précision.
Analyse des risques: La régression linéaire dépend uniquement des données historiques et n’est pas sensible aux événements inattendus tels que les nouvelles de profits et pertes importants, ce qui peut générer de faux signaux. De plus, les paramètres tels que la longueur du cycle de régression peuvent également affecter la performance de la stratégie.
Les directions d’optimisation Nous pensons que cette stratégie peut être optimisée dans les domaines suivants:
- Adhésion à un mécanisme de stop-loss. Lorsque le prix dépasse la ligne de stop-loss, le contrôle efficace des pertes causées par des signaux erronés individuels.
- Introduction de modèles d’apprentissage automatique. Utilisation de modèles plus efficaces pour prédire les tendances des prix et améliorer la précision des stratégies.
- Combinaison avec des indicateurs d’émotion. Introduction d’indicateurs d’émotion tels que l’indice de peur du marché, pour juger de l’ambiance de vente et d’achat sur le marché et améliorer la victoire de la stratégie.
- La combinaison de plusieurs fuseaux horaires. Les prévisions de différentes périodes de temps peuvent se vérifier les unes les autres, formant une stratégie de combinaison, réduisant les limites d’une seule fuseau horaire.
Résumé: Cette stratégie a les avantages d’une logique de prévision claire, d’un risque contrôlable et d’un espace d’optimisation plus large. Nous sommes convaincus que ses performances seront de plus en plus excellentes grâce à une optimisation et une répétition continues. Elle nous offre des idées pour effectuer des transactions quantitatives en utilisant des méthodes de prévision scientifiques, qui méritent notre étude et notre application approfondies.
/*backtest
start: 2023-12-07 00:00:00
end: 2023-12-14 00:00:00
period: 1m
basePeriod: 1m
exchanges: [{"eid":"Futures_Binance","currency":"BTC_USDT"}]
*/

// This source code is subject to the terms of the Mozilla Public License 2.0 at https://mozilla.org/MPL/2.0/
// © stocktechbot

//@version=5
strategy("Linear On MACD", overlay=true, margin_long=100, margin_short=100)


fast_length = input(title="Fast Length", defval=12)
slow_length = input(title="Slow Length", defval=26)
tolerance = input.string(title="Risk tolerance", defval = "LOW", options=["LOW", "HIGH"])

chng = 0
obv = ta.cum(math.sign(ta.change(close)) * volume)
if close < close[1] and (open < close)
    chng := 1
else if close > close[1]
    chng := 1
else
    chng := -1
obvalt = ta.cum(math.sign(chng) * volume)
//src = input(title="Source", defval=close)
src = obvalt
signal_length = input.int(title="Signal Smoothing",  minval = 1, maxval = 50, defval = 9)
sma_source = input.string(title="Oscillator MA Type",  defval="EMA", options=["SMA", "EMA"])
sma_signal = input.string(title="Signal Line MA Type", defval="EMA", options=["SMA", "EMA"])

// Calculating
fast_ma = sma_source == "SMA" ? ta.sma(src, fast_length) : ta.ema(src, fast_length)
slow_ma = sma_source == "SMA" ? ta.sma(src, slow_length) : ta.ema(src, slow_length)
macd = fast_ma - slow_ma
signal = sma_signal == "SMA" ? ta.sma(macd, signal_length) : ta.ema(macd, signal_length)
hist = macd - signal
//hline(0, "Zero Line", color=color.new(#787B86, 50))
//plot(hist, title="Histogram", style=plot.style_columns, color=(hist>=0 ? (hist[1] < hist ? col_grow_above : col_fall_above) : (hist[1] < hist ? col_grow_below : col_fall_below)))
//plot(macd, title="MACD", color=col_macd)
//plot(signal, title="Signal", color=col_signal)
[macdLine, signalLine, histLine] = ta.macd(close, 12, 26, 9)

//Linear Regression

vol = volume

// Function to calculate linear regression
linregs(y, x, len) =>
    ybar = math.sum(y, len)/len
    xbar = math.sum(x, len)/len
    b = math.sum((x - xbar)*(y - ybar),len)/math.sum((x - xbar)*(x - xbar),len)
    a = ybar - b*xbar
    [a, b]

// Historical stock price data
price = close

// Length of linear regression
len = input(defval = 21, title = 'Lookback')

// Calculate linear regression for stock price based on volume
[a, b] = linregs(price, vol, len)

// Predicted stock price based on volume
predicted_price = a + b*vol

// Check if predicted price is between open and close
is_between = open < predicted_price and predicted_price < close


// Plot predicted stock price
plot(predicted_price, color=color.rgb(218, 27, 132), linewidth=2, title="Predicted Stock Price")
plot(ta.vwma(predicted_price,len), color=color.rgb(199, 43, 64), linewidth=2, title="Predicted Stock Price")

//BUY Signal
lincrossunder = close > predicted_price
macdrise = ta.rising(macd,2)
//macdvollong = ta.crossover(macd, signal)
//macdlong = ta.crossover(macdLine, signalLine)
macdvollong = macd > signal
macdlong = macdLine > signalLine
longCondition=false
if macdlong and macdvollong and is_between and ta.rising(predicted_price,1)
    longCondition := true

if (longCondition)
    strategy.entry("My Long Entry Id", strategy.long)
//Sell Signal
lincrossover = close < predicted_price
macdfall = ta.falling(macd,1)
macdsell = macd < signal
shortCondition = false
risklevel = predicted_price
if (tolerance == "HIGH")
    risklevel := ta.vwma(predicted_price,len)


if macdfall and macdsell and (macdLine < signalLine) and (close < risklevel)
    shortCondition := true


if (shortCondition)
    strategy.entry("My Short Entry Id", strategy.short)