概述
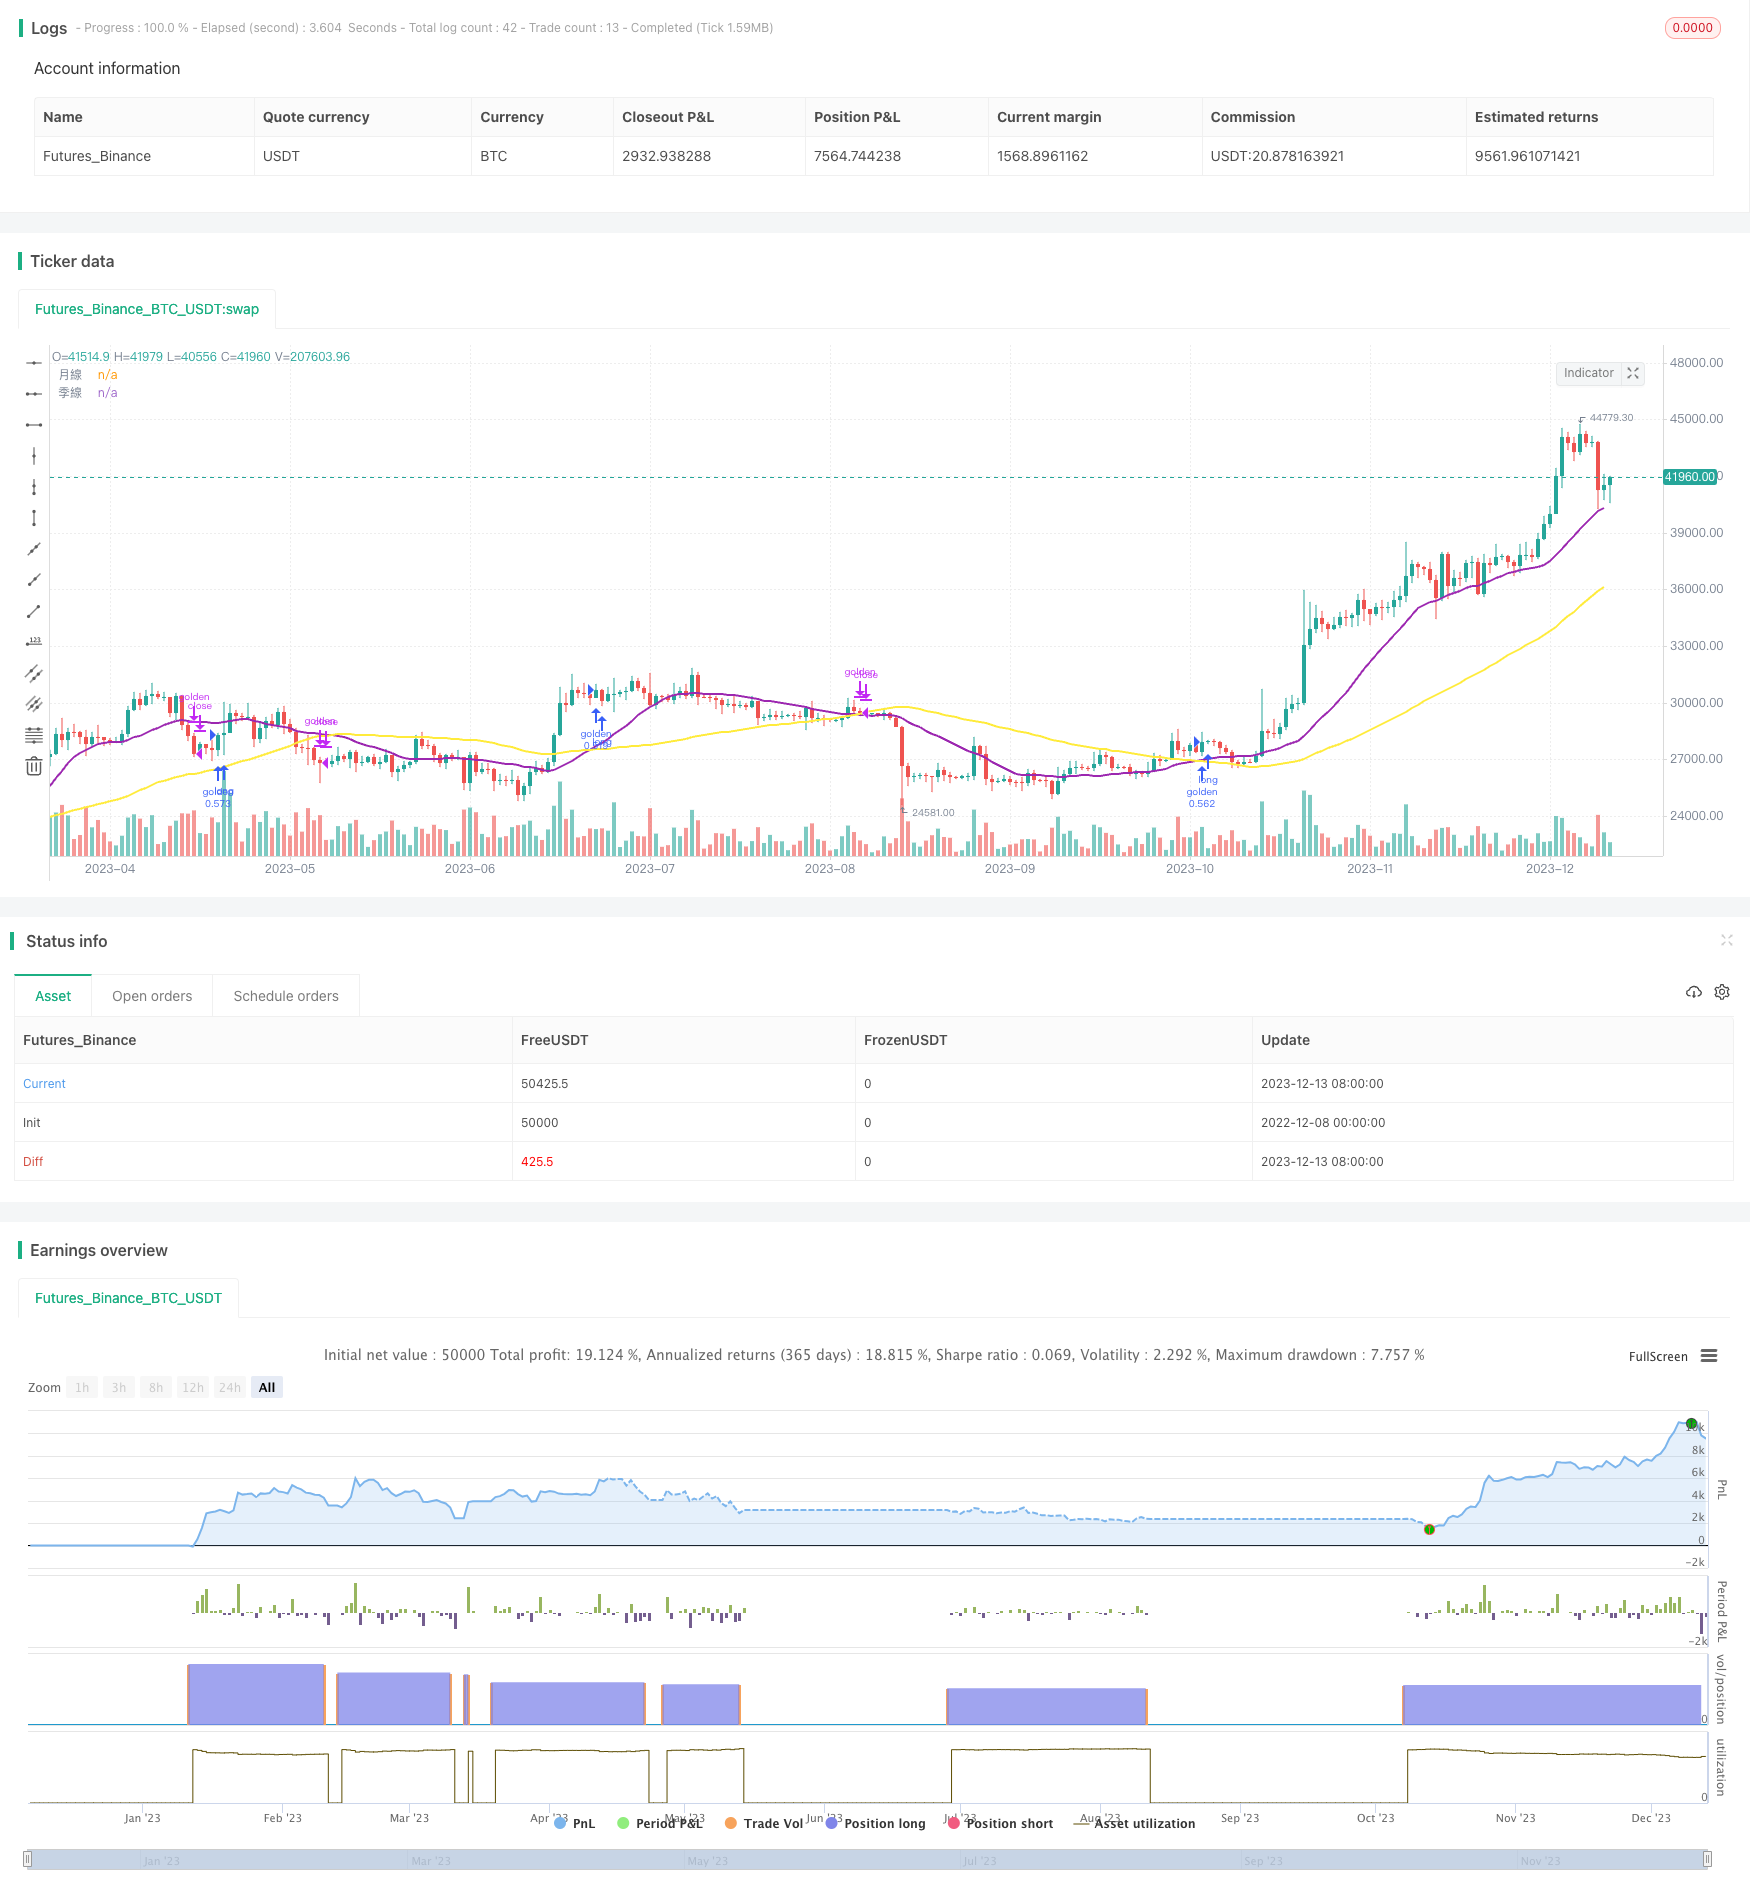
本策略主要基于月线和季线的均线进行操作,具体来说是20日线作为月线,60日线作为季线,策略信号来源为两条均线的金叉死叉。当月线上穿季线时 longing,形成多头信号;当月线下穿季线时进行清仓平仓。该策略适用于中长线操作,通过捕捉盘整背驰机会获利。
策略原理
本策略使用20日简单移动均线作为月线指标,60日简单移动均线作为季线指标。具体交易信号生成逻辑如下:
- 当20日线上穿60日线时,即发生金叉时,做多入场。
- 当股价较10日内最高点回撤超过10%时,平仓止盈。
- 当20日线下穿60日线时,即发生死叉时,清仓平仓。
- 当亏损达到10%时,止损出场。
通过月线和季线的均线交叉来判断中长线趋势,金叉做多表示进入中长线牛市,死叉做空表示进入中长线熊市。同时结合止盈止损策略控制风险。
策略优势
- 使用月季线均线,过滤市场噪音,捕捉中长线趋势。
- 策略参数简单,容易实现。
- 可配置止盈止损参数,控制风险。
风险分析
- 无法确定趋势反转点,存在亏损风险。
- 月线和季线均线存在滞后,可能错过短线机会。
- 需要选取合适的止损点,以免过于激进被秒出。
解决方法:
- 采用移动止损追踪,及时止损。
- 结合其他指标过滤信号,确定趋势。
- 调整均线参数,优化策略。
策略优化方向
- 增加其他指标过滤,如KD指标等,避免假突破。
- 优化均线参数,寻找最佳均线周期组合。
- 增加止盈策略,如移动止盈等,获取更多盈利。
总结
本策略Overall XXXXX系统atically利用月季线均线的优势,通过均线的金银死叉来判断中长线趋势方向。同时配置合理的止盈止损机制控制风险。策略优化空间还很大,值得进一步测试优化。
策略源码
/*backtest
start: 2022-12-08 00:00:00
end: 2023-12-14 00:00:00
period: 1d
basePeriod: 1h
exchanges: [{"eid":"Futures_Binance","currency":"BTC_USDT"}]
*/

//@version=4
strategy("均線操作-月季", overlay=true, initial_capital = 100000, default_qty_type = strategy.percent_of_equity, default_qty_value = 30)
sma20 = sma(close, 20)
sma60 = sma(close, 60)

plot(sma20, title="月線", color=color.purple,linewidth=2)
plot(sma60, title="季線", color=color.yellow,linewidth=2)

backtest_year = input(title="backtest_year",type=input.integer,defval=2020)
backtest_month = input(title="backtest_month",type=input.integer,defval=10)
backtest_date = input(title="backtest_date",type=input.integer,defval=1)
backtest_start_time = timestamp(backtest_year,backtest_month,backtest_date,0,0,0)

to_long = sma20 > sma60  and close > highest(10)*0.9 // 黃金交叉
to_close = sma20 < sma60 // 死亡交叉
to_exit = close < highest(10)*0.9 //股價嚴重回檔
to_stop = close < 0.9*strategy.position_avg_price

// to_long = crossover(sma20, sma60)   // 黃金交叉
// to_close = crossunder(sma20, sma60) // 死亡交叉

//plotchar(to_long, char="B", text="買", color=color.red, location=location.belowbar)
//plotchar(to_close, char="S", text="賣", color=color.green, location=location.abovebar)
//strategy.close("open long",when = tslide, comment="多單滑價7%出場")
if true
    strategy.entry("golden", strategy.long,  when=to_long,comment="多單入場")
    strategy.close("golden",  when=to_exit,comment="多單滑價7%出場")
    strategy.close("golden",  when=to_close,comment="月線季線死亡交叉")
    strategy.close("golden",  when=to_stop,comment="虧損10%強迫停損")
更多内容