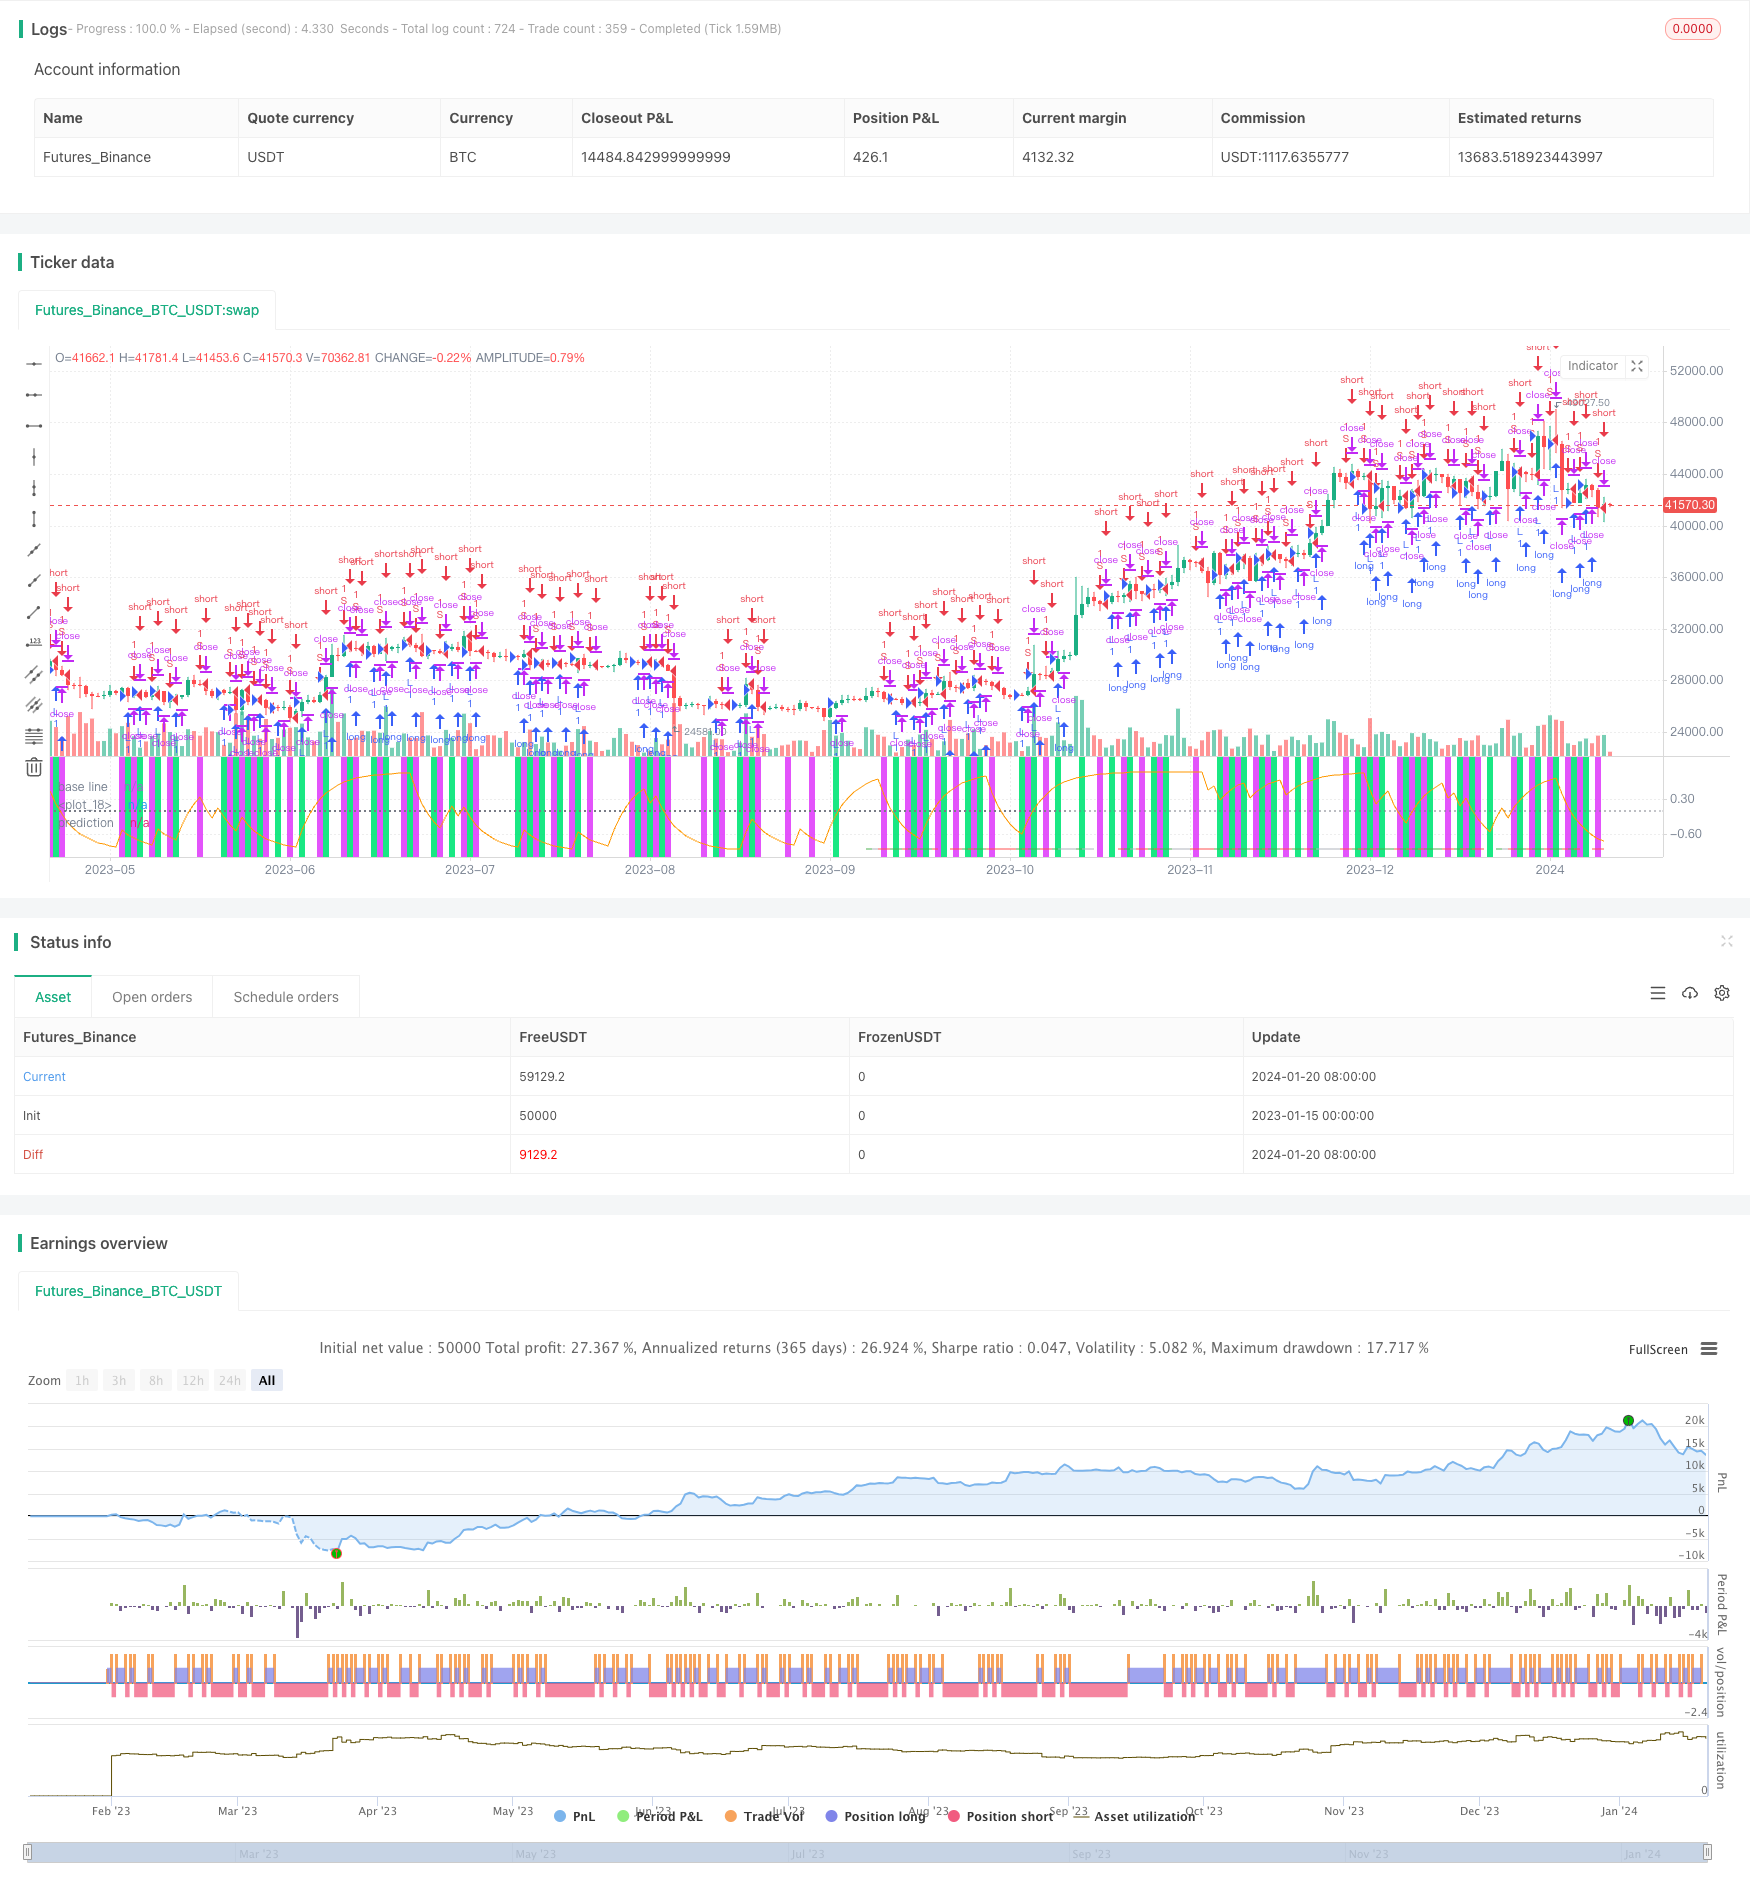
Stratégie vectorielle normalisée à l'échelle avec fonctions d'activation, ver.4
Auteur:ChaoZhang est là., Date: 2024-01-22 09h02h30Les étiquettes:

Résumé
Il s'agit d'une amélioration de la stratégie de vecteur normalisé à échelle de drkhodakarami, ajoutant principalement des fonctions d'activation pour améliorer les performances de la stratégie. La stratégie calcule le taux de changement du marché en fonction des différences de temps et détermine les signaux longs et courts en fonction des valeurs de seuil.
La logique de la stratégie
- Calculer la variation en pourcentage du prix x de clôture sur la période définie
- Passer x à la fonction d'activation pour obtenir la séquence traitée p
- Définir des seuils positifs et négatifs th, aller long lorsque p traverse au-dessus de th, et aller court lorsque traverse en dessous de -th
- Désactiver la repeinture pour éviter les faux signaux
Analyse des avantages
- Les fonctions d'activation aident à filtrer le bruit et à améliorer le jugement du signal
- Une nouvelle entrée et une logique étroite permettent le trading automatisé
- Plus de personnalisation de paramètres s'adapte à plus de marchés
- Une excellente visualisation présente intuitivement les signaux commerciaux
Analyse des risques
- Des seuils incorrects peuvent faire perdre des opportunités commerciales
- Les fonctions d'activation inappropriées peuvent filtrer trop l'information sur le marché
- Les distorsions de signal induites par la repeinture doivent être testées
Les solutions:
- Ajustez les paramètres de seuil pour trouver le meilleur
- Essayez différentes fonctions d'activation pour trouver la meilleure correspondance
- Ajouter la logique de détection de repeinture pour confirmer les signaux valides
Directions d'optimisation
- Ajouter un seuil adaptatif
- Optimiser les paramètres de la fonction d'activation
- Incorporer un stop-loss automatique
- Filtrez les signaux avec plus de facteurs
Conclusion
Cette stratégie introduit des fonctions d'activation pour améliorer les performances. La personnalisation des paramètres étendue s'adapte mieux aux changements du marché. Pendant ce temps, l'excellente visualisation présente intuitivement des opportunités de trading. Les prochaines étapes consistent à optimiser davantage les fonctions d'activation et les paramètres de seuil, à incorporer une logique de stop loss et plus de filtrage de signal pour atteindre une efficacité de stratégie encore meilleure.
/*backtest
start: 2023-01-15 00:00:00
end: 2024-01-21 00:00:00
period: 1d
basePeriod: 1h
exchanges: [{"eid":"Futures_Binance","currency":"BTC_USDT"}]
*/

//@version=4
// author: capissimo
strategy("Scaled Normalized Vector Strategy, ver.4", precision=2, overlay=false)
// This is a modification of my Scaled Normalized Vector Strategy
// original: Drkhodakarami (https://www.tradingview.com/script/Fxv2xFWe-Normalized-Vector-Strategy-By-Drkhodakarami-Opensource/)

price    = input(close,  "Price Data")
tf       = input(18,     "Timeframe", minval=1, maxval=1440)
thresh   = input(14.,    "Threshold", minval=.1, step=.1)
div      = input(1000000,"Divisor", options=[1,10,100,1000,10000,100000,1000000,10000000,100000000])
mmx      = input(233,    "Minimax Lookback", options=[1, 2, 3, 5, 8, 13, 21, 34, 55, 89, 144, 233, 377, 610, 987, 1597, 2584])
showVol  = input(false,  "Volume")
useold   = input(true,   "Use Old System")
method   = input("Swish", "Activation", options=["Step", "LReLU", "Swish", "None"])

scaleMinimax(X, p, min, max) =>
    hi = highest(X, p), lo = lowest(X, p)
    (max - min) * (X - lo)/(hi - lo) + min

getdiff(prc, tf) =>
    prev  = scaleMinimax((useold ? security(syminfo.tickerid, tostring(tf), prc[1], barmerge.gaps_off, barmerge.lookahead_on)
                                 : security(syminfo.tickerid, tostring(tf), prc[1])), tf, 0, 1)
    curr  = scaleMinimax((useold ? security(syminfo.tickerid, tostring(tf), hlc3, barmerge.gaps_off, barmerge.lookahead_on)
                                 : security(syminfo.tickerid, tostring(tf), hlc3)), tf, 0, 1)
    (curr/prev) - 1

relu(x) => max(x, 0)
lrelu(x, alpha) => relu(x) - alpha * relu(-x)
step(x) => x >= 0 ? 1 : -1
log2(x) => log(x) / log(2)
sigmoid(x) => 1 / (1 + exp(-x))
swish(x) => x * sigmoid(x)

f(m) => method==m

vol  = useold ? security(syminfo.tickerid, tostring(tf), volume, barmerge.gaps_off, barmerge.lookahead_on)
              : security(syminfo.tickerid, tostring(tf), volume)
obv  = cum(change(price) > 0 ? vol : change(price) < 0 ? -vol : 0*vol)
prix = showVol ? obv : price
x    = getdiff(prix, tf)
p    = f("Swish") ? swish(x) : f("Step") ? step(x) : f("LReLU") ? lrelu(x, .8) : x
th   = thresh/div
long = crossover(p, th)
short= crossunder(p, -th)

lime  = color.new(color.lime, 10), fuchsia = color.new(color.fuchsia, 10),
black = color.new(color.black, 100), gray = color.new(color.gray, 50)
bg    = long ? lime : short ? fuchsia : black
cl    = p > th ? color.green : p < -th ? color.red : color.silver

bgcolor(bg, editable=false)
plot(scaleMinimax(th, mmx, -1, 1), color=lime, editable=false, transp=0)
hline(0, linestyle=hline.style_dotted, title="base line", color=gray, editable=false)
plot(scaleMinimax(-th, mmx, -1, 1), color=fuchsia, editable=false, transp=0)
plot(scaleMinimax(p, mmx, -1, 1), color=cl, style=plot.style_histogram, transp=70, editable=false)
plot(scaleMinimax(p, mmx, -1, 1), color=cl, style=plot.style_linebr, title="prediction", transp=0, editable=false)

strategy.entry("L", true, 1, when=long)
strategy.entry("S", false, 1, when=short)

alertcondition(long, title='Long', message='Long Signal!')
alertcondition(short, title='Short', message='Short Signal!')

//*** Karobein Oscillator
per  = input(8, "Karobein Osc Lookback")

prix2 = ema(price, per)
a = ema(prix2 < prix2[1] ? prix2/prix2[1] : 0, per)
b = ema(prix2 > prix2[1] ? prix2/prix2[1] : 0, per)
c = (prix2/prix2[1])/(prix2/prix2[1] + b)
d = 2*((prix2/prix2[1])/(prix2/prix2[1] + c*a)) - 1

plot(scaleMinimax(d, mmx, -1, 1), color=color.orange, transp=0)
- Stratégie de négociation hebdomadaire
- Stratégie de négociation MACD basée sur EVWMA
- Stratégie d'inversion moyenne des bandes de Bollinger pour la rupture du canal
- Stratégie quantitative de suivi des tendances basée sur plusieurs indicateurs techniques
- Stratégie de négociation quantitative combinée RSI et CCI
- Stratégie de négociation de tendance en DCA à faible risque
- Stratégie de dynamique stochastique
- Stratégie de suivi des tendances de l'oscillateur de dynamique
- Moyenne mobile avec décalage zéro et stratégie de négociation de sortie Chandelier
- RSI 5 Stratégie de négociation à la dynamique
- Tendance suivant la stratégie basée sur un sommet historique
- La tendance des crypto-monnaies suivant la stratégie basée sur Heiken Ashi
- Stratégie quantitative de suivi de la tendance de la force de la MA
- Stratégie de négociation par canal de prix à moyenne mobile double
- Stratégie de scalping de 5 minutes pour le Bitcoin et l'or 2.0
- Stratégie multi-DCA de l'EMA avec arrêt des pertes et objectif de profit
- Tendance à la suite d'une stratégie basée sur les enveloppes Nadaraya-Watson et l'indicateur ROC