RSI Stratégie de négociation des bandes de Bollinger
Auteur:ChaoZhang est là., Date: 2024-01-24 14:56:02 Je vous en prie.Les étiquettes:

Résumé
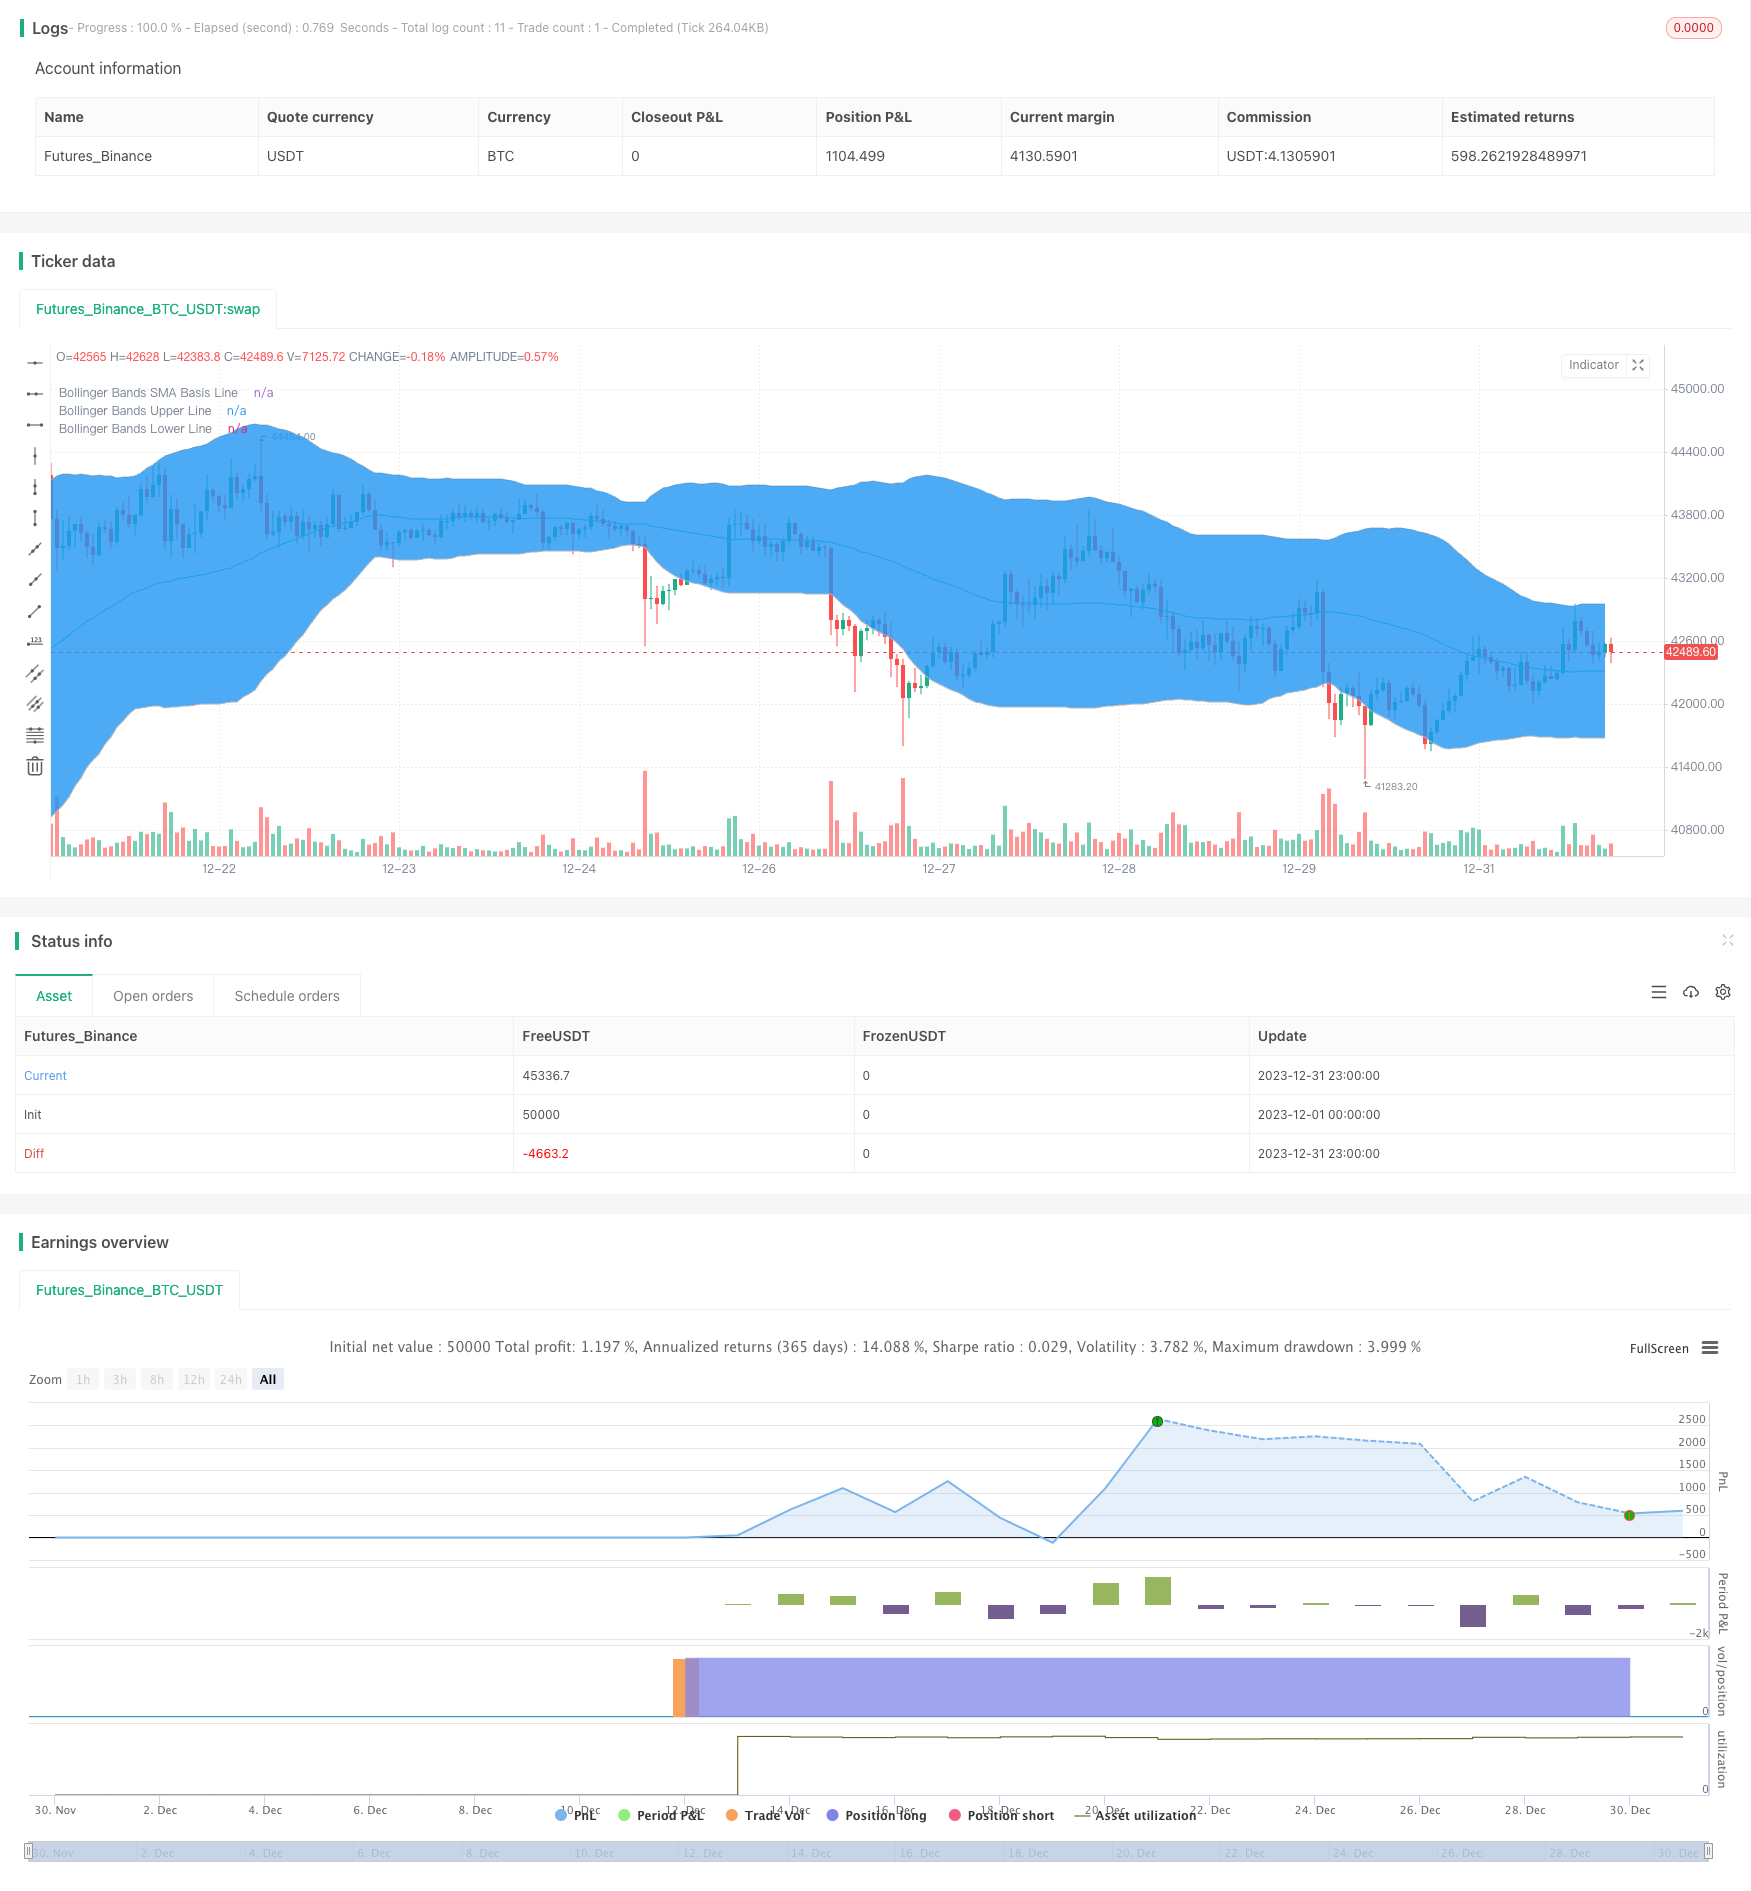
Cette stratégie utilise principalement l'indice de force relative (RSI) combiné avec les bandes de Bollinger pour le jugement des signaux de trading.
La logique de la stratégie
L'indicateur RSI reflète la force relative de l'instrument de trading. Lorsque l'indicateur RSI est en dessous de la zone de survente (défaut 30), cela signifie que l'instrument est survendu et doit acheter. Les bandes de Bollinger comprennent la bande supérieure, la bande moyenne et la bande inférieure, ce qui reflète bien la fourchette de fluctuation des prix. Acheter près de la bande inférieure et vendre près de la bande supérieure peut fournir des signaux relativement fiables. Cette stratégie combine l'indicateur RSI et les bandes de Bollinger pour le jugement des signaux de trading.
Les avantages
- La combinaison du RSI et des bandes de Bollinger améliore la précision du signal
- Le RSI filtre le bruit
- Les bandes de Bollinger reflètent la fourchette de volatilité actuelle du marché, des signaux fiables
- Règles de négociation strictes, évitant les transactions non valides
Les risques
- Les paramètres incorrects des bandes de Bollinger peuvent entraîner des signaux inexacts
- L'indicateur d'indicatif de risque de surachat/survente peut avoir une incidence sur les jugements
- La stratégie est stricte, peut manquer certaines opportunités
Les solutions:
- Optimiser les bandes de Bollinger et les paramètres du RSI pour trouver la meilleure combinaison
- Relaxez les conditions modérément, permettez quelques transactions invalides pour plus de chances
Directions d'optimisation
- Testez et optimisez les paramètres RSI et Bollinger
- Ajouter un stop loss au contrôle des risques
- Considérez l'ajout d'autres indicateurs tels que le MACD pour la vérification du signal
- Résultats des tests d'optimisation pour différents produits et périodes
Résumé
La stratégie globale est robuste, combinant efficacement RSI et Bollinger Bands pour le stop loss. Une amélioration supplémentaire peut être obtenue en testant et en optimisant les paramètres. Il faut également être conscient des risques potentiels de signal manquant en raison de règles strictes. En général, il s'agit d'une stratégie de trading quantitative fiable.
/*backtest
start: 2023-12-01 00:00:00
end: 2023-12-31 23:59:59
period: 1h
basePeriod: 15m
exchanges: [{"eid":"Futures_Binance","currency":"BTC_USDT"}]
*/

//@version=2
strategy("BB + RSI 20MIN,", shorttitle="BBRSI 20MIN", overlay=true )

     // Strategy Tester Start Time
sYear = input(2019, title = "Start Year")
sMonth = input(04, title = "Start Month", minval = 01, maxval = 12)
sDay = input(01, title = "Start Day", minval = 01, maxval = 31)
sHour = input(00, title = "Start Hour", minval = 00, maxval = 23)
sMinute = input(00, title = "Start Minute", minval = 00, maxval = 59)
startTime = true


///////////// RSI
RSIlength = input(9,title="RSI Period Length")
RSIoverSold = input(30, minval=1,title="RSIL")
RSIoverBought = input(69, minval=1,title="RSIh")
price = open
vrsi = rsi(price, RSIlength)


///////////// Bollinger Bands
BBlength = input(60, minval=1,title="Bollinger Period Length")
BBmult = input(2.0, minval=0.001, maxval=50,title="Bb")
BBbasis = sma(price, BBlength)
BBdev = BBmult * stdev(price, BBlength)
BBupper = BBbasis + BBdev
BBlower = BBbasis - BBdev
source = close
buyEntry = crossover(source, BBlower)
sellEntry = crossunder(source, BBupper)
plot(BBbasis, color=aqua,title="Bollinger Bands SMA Basis Line")
p1 = plot(BBupper, color=silver,title="Bollinger Bands Upper Line")
p2 = plot(BBlower, color=silver,title="Bollinger Bands Lower Line")
fill(p1, p2)


///////////// Colors
switch1=input(true, title="Enable Bar Color?")
switch2=input(true, title="Enable Background Color?")
TrendColor = RSIoverBought and (price[1] > BBupper and price < BBupper) and BBbasis < BBbasis[1] ? red : RSIoverSold and (price[1] < BBlower and price > BBlower) and BBbasis > BBbasis[1] ? green : na
barcolor(switch1?TrendColor:na)
bgcolor(switch2?TrendColor:na,transp=50)


///////////// RSI + Bollinger Bands Strategy
if (not na(vrsi))

    if (crossover(vrsi, RSIoverSold) and crossover(source, BBlower))
        strategy.entry("RSI_BB_L", strategy.long and startTime, stop=BBlower,  comment="RSI_BB_L")
    else
        strategy.cancel(id="RSI_BB_L")

    if (crossunder(vrsi, RSIoverBought) and crossunder(source, BBupper))
        strategy.entry("RSI_BB_S", strategy.short and startTime, stop=BBupper,comment="RSI_BB_S")
    else
        strategy.cancel(id="RSI_BB_S")

//plot(strategy.equity, title="equity", color=red, linewidth=2, style=areabr)
- Stratégie de scalping intradial de l'EMA
- Stratégie composée d'arrêt des pertes et de prise de bénéfices basée sur une entrée aléatoire
- Stratégie inversée du filtre à bande passante
- Stratégie de négociation croisée à double moyenne mobile
- RSI combiné à des bandes de Bollinger et à une stratégie quantitative de soutien/résistance dynamique
- La valeur de l'indice de volatilité est la valeur de l'indice de volatilité.
- Stratégie de négociation quantitative combinée à plusieurs indicateurs
- Contrarian Donchian Channel Touch Entry Strategy avec pause de perte post-stop et perte de stop de suivi
- Stratégie de négociation à court terme pour l'indicateur à bougie unique intraday
- Stratégie de négociation croisée de moyenne mobile
- Tendance à la suite d'une stratégie basée sur la double EMA
- Stratégie de rupture de la moyenne mobile double
- RSI et stratégie de rupture des moyennes mobiles
- Stratégie de suivi de l'EMA
- Tendance suivant une stratégie basée sur la moyenne mobile
- Stratégie de négociation quantitative basée sur le volume basée sur la profondeur de marché d'Ichimoku
- Stratégie de suivi des tendances Stop Loss Take Profit
- Stratégie de contre-essai de l'indicateur Qstick pour le traversement bidirectionnel de l'axe zéro
- Stratégie de négociation croisée de moyenne mobile
- Stratégie de divergence de la moyenne mobile