Stratégie de rupture de la SR
Auteur:ChaoZhang est là., Date: 2024-05-15 16h30 et 14hLes étiquettes:
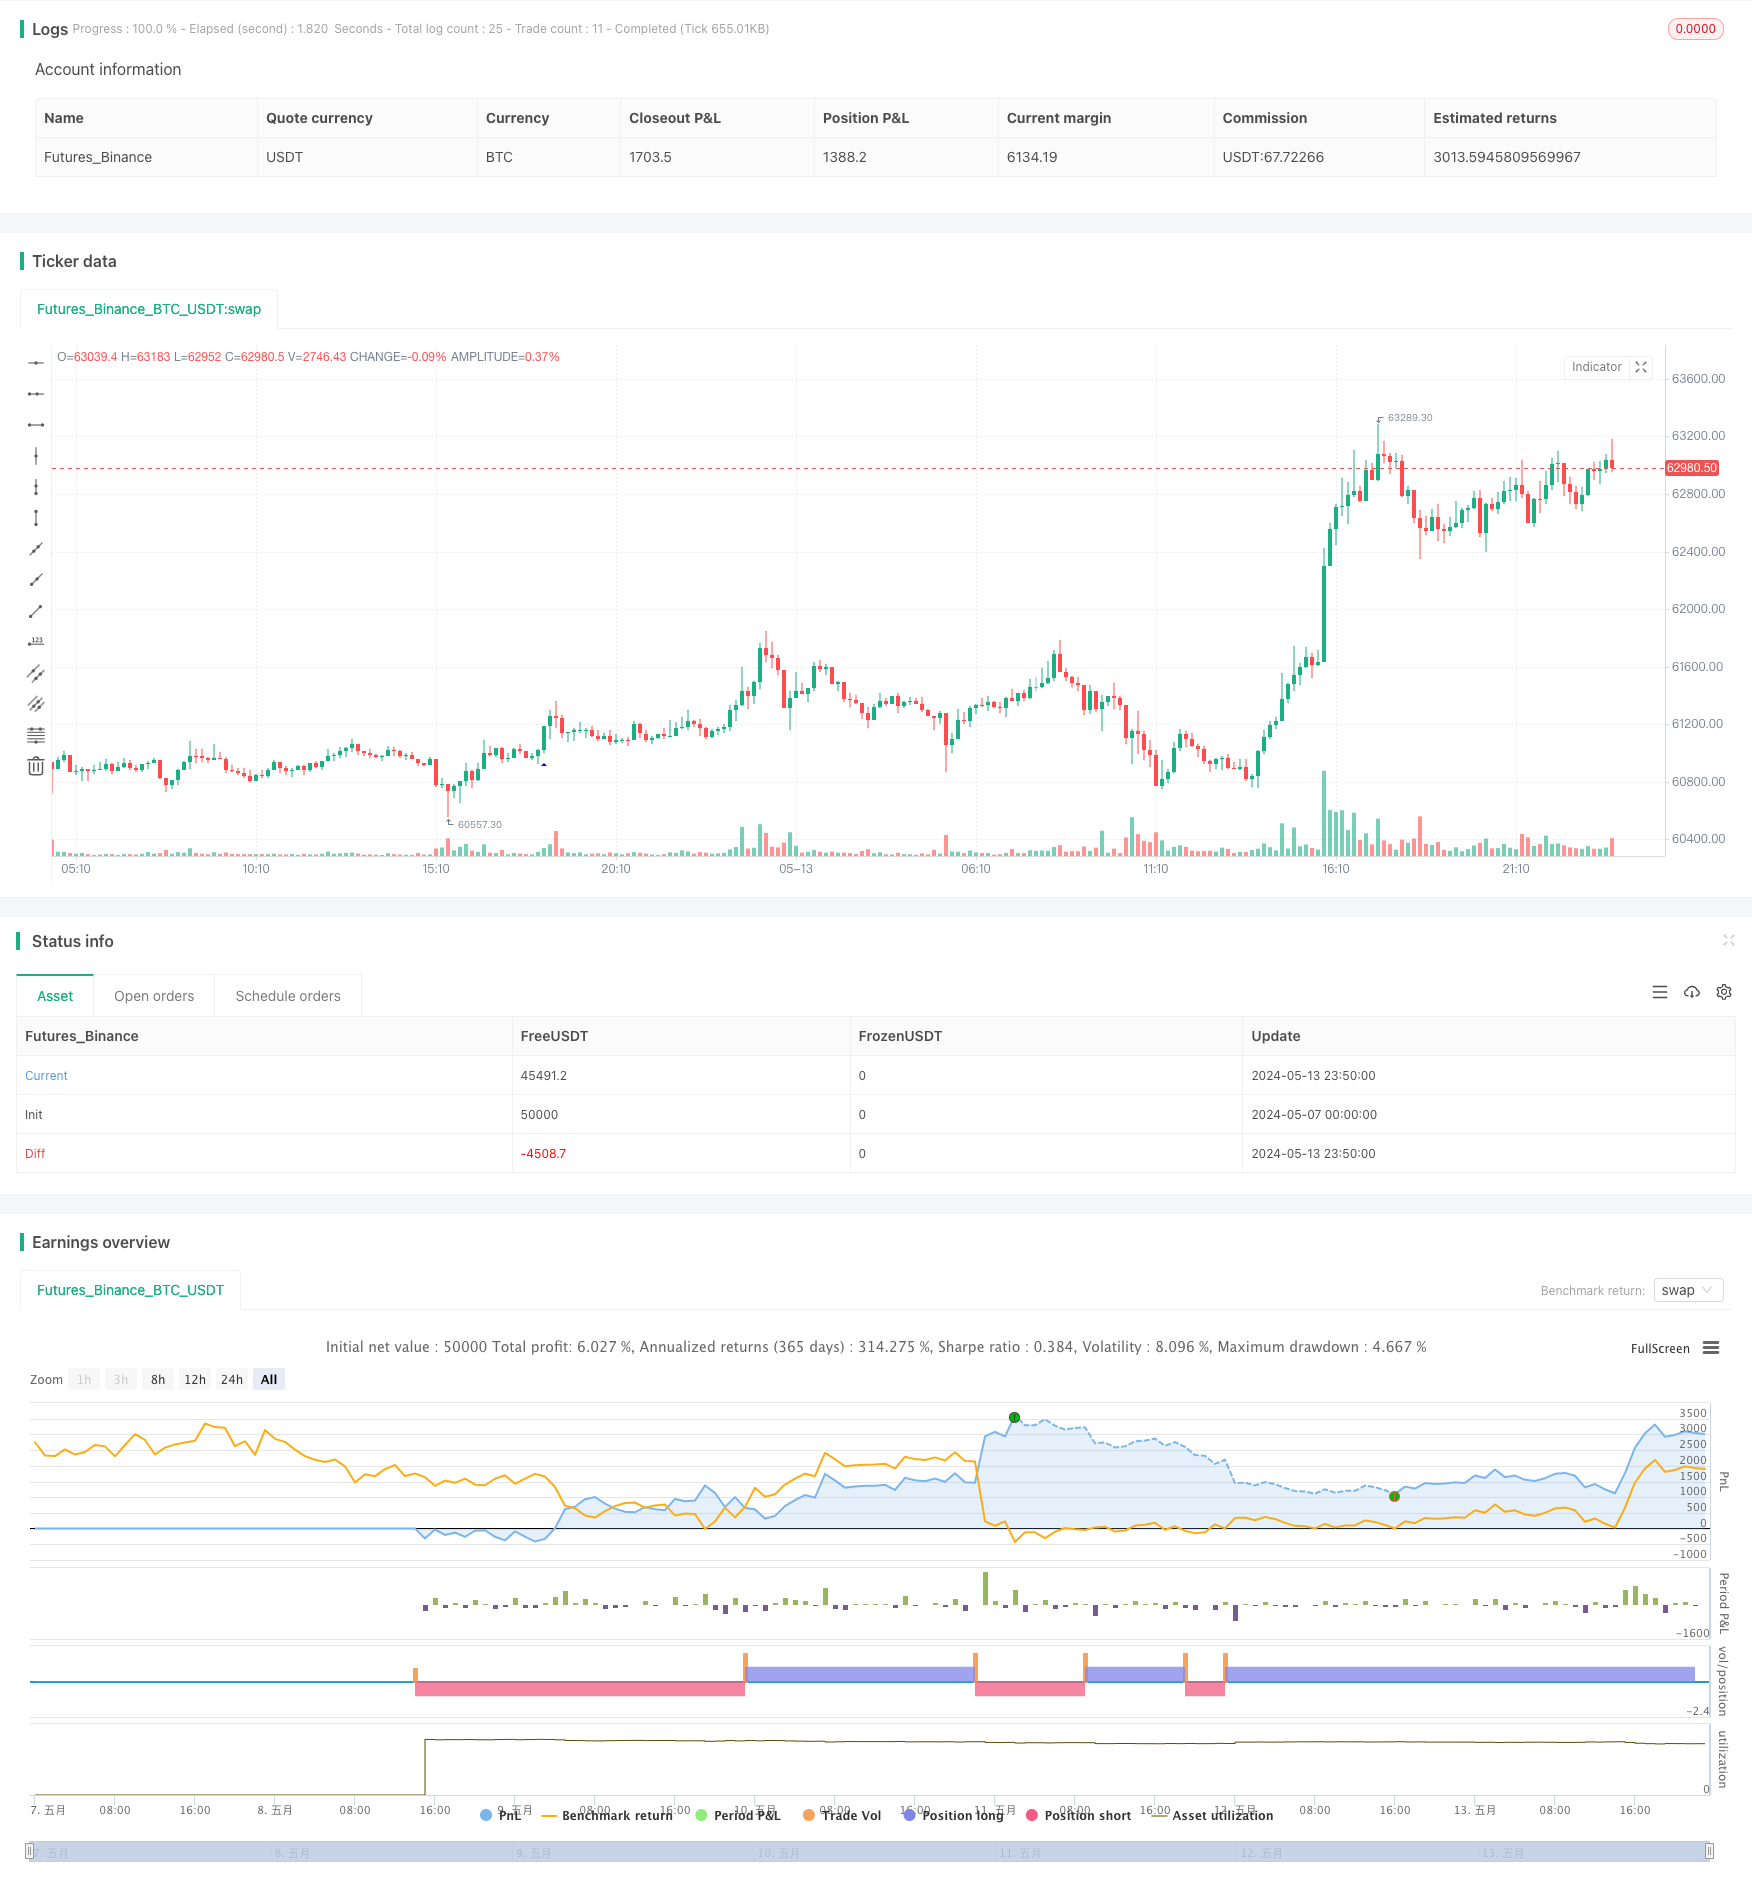
Résumé
La stratégie de rupture de SR est une stratégie de rupture de support et de résistance développée sur la base de l'indicateur de recherche de rupture de LonesomeTheBlue
Principe de stratégie
- Utilisez les fonctions pivothigh et pivotlow pour calculer les hauts et les bas au cours d'une certaine période de temps et les stocker dans des tableaux.
- Déterminez si le prix de clôture actuel est supérieur au niveau de résistance. Si oui, il est jugé comme une rupture haussière et un signal long est généré.
- Déterminez si le prix de clôture actuel est inférieur au niveau de support.
- Après génération d'un signal de négociation, calculer les prix d'arrêt des pertes et de prise de profit sur la base des ratios d'arrêt des pertes et de prise de profit définis, et définir les ordres d'arrêt des pertes et de prise de profit correspondants.
- Tracer la plage de rupture correspondante selon la direction de rupture.
Les avantages de la stratégie
- La rupture de support et de résistance est une stratégie de trading classique avec une certaine base pratique.
- En utilisant les fonctions pivothigh et pivotlow pour calculer les niveaux de support et de résistance, les opportunités de rupture peuvent être capturées de manière relativement précise.
- La structure du code de cette stratégie est claire, et en stockant des hauts et des bas dans des tableaux, il est pratique pour le backtesting et l'optimisation.
- Le stop loss et le take profit sont définis, ce qui permet de contrôler relativement bien les risques.
Risques stratégiques
- La stratégie de rupture de support et de résistance présente de faibles résultats sur les marchés instables et est sujette à de fréquentes fausses ruptures.
- Les taux de stop-loss et de prise de profit fixes peuvent ne pas être en mesure de s'adapter aux différentes conditions du marché, ce qui entraîne un déséquilibre entre risque et rendement.
- Cette stratégie ne prend en compte que les facteurs de prix et ne prend pas en compte d'autres indicateurs importants tels que le volume des transactions, qui peuvent manquer certains signaux importants.
Direction de l'optimisation de la stratégie
- Il convient d'envisager l'introduction d'indicateurs plus techniques, tels que le volume des transactions, le MACD, etc., afin d'améliorer la précision et la fiabilité des signaux.
- Pour le stop loss et le take profit, envisagez d'utiliser un trailing stop ou un dynamic stop loss et des take profit ratios pour mieux vous adapter aux différentes conditions du marché.
- Considérez l'introduction de conditions de filtrage, telles que le filtrage des tendances, le filtrage de la volatilité, etc., afin de réduire les fausses ruptures sur les marchés instables.
- Envisagez d'optimiser les niveaux de support et de résistance, par exemple en utilisant des périodes d'adaptation, en introduisant des niveaux de Fibonacci, etc.
Résumé
La stratégie de rupture de SR est une stratégie de trading basée sur l'idée classique de rupture de support et de résistance. En utilisant les fonctions pivothigh et pivotlow pour calculer les niveaux de support et de résistance, et en jugeant si le prix de clôture dépasse ces niveaux pour générer des signaux de trading. L'avantage de cette stratégie est que l'idée est claire et facile à mettre en œuvre et à optimiser; en même temps, il existe également certains risques, tels que de mauvaises performances sur les marchés agités, et les risques pouvant être causés par des ratios de stop loss et de profit fixes.
/*backtest
start: 2024-05-07 00:00:00
end: 2024-05-14 00:00:00
period: 10m
basePeriod: 1m
exchanges: [{"eid":"Futures_Binance","currency":"BTC_USDT"}]
*/

// This source code is subject to the terms of the Mozilla Public License 2.0 at https://mozilla.org/MPL/2.0/
// © LonesomeTheBlue © chanu_lev10k

//@version=5
strategy('SR Breakout Strategy', overlay=true, max_bars_back=500, max_lines_count=400)
prd = input.int(defval=5, title='Period', minval=2)
bo_len = input.int(defval=71, title='Max Breakout Length', minval=30, maxval=300)
cwidthu = input.float(defval=3., title='Threshold Rate %', minval=1., maxval=10) / 100
mintest = input.int(defval=2, title='Minimum Number of Tests', minval=1)
bocolorup = input.color(defval=color.blue, title='Breakout Colors', inline='bocol')
bocolordown = input.color(defval=color.red, title='', inline='bocol')
// lstyle = input.string(defval=line.style_solid, title='Line Style')
issl = input.bool(title='SL', inline='linesl1', group='Stop Loss / Take Profit:', defval=false)
slpercent = input.float(title=', %', inline='linesl1', group='Stop Loss / Take Profit:', defval=18.0, minval=0.0, step=0.1)
istp = input.bool(title='TP', inline='linetp1', group='Stop Loss / Take Profit:', defval=false)
tppercent = input.float(title=', %', inline='linetp1', group='Stop Loss / Take Profit:', defval=18.0, minval=0.0, step=0.1)

//width
lll = math.max(math.min(bar_index, 300), 1)
float h_ = ta.highest(lll)
float l_ = ta.lowest(lll)
float chwidth = (h_ - l_) * cwidthu

// check if PH/PL
ph = ta.pivothigh(prd, prd)
pl = ta.pivotlow(prd, prd)

//keep Pivot Points and their locations in the arrays
var phval = array.new_float(0)
var phloc = array.new_int(0)
var plval = array.new_float(0)
var plloc = array.new_int(0)

// keep PH/PL levels and locations
if bool(ph)
    array.unshift(phval, ph)
    array.unshift(phloc, bar_index - prd)
    if array.size(phval) > 1  // cleanup old ones
        for x = array.size(phloc) - 1 to 1 by 1
            if bar_index - array.get(phloc, x) > bo_len
                array.pop(phloc)
                array.pop(phval)

if bool(pl)
    array.unshift(plval, pl)
    array.unshift(plloc, bar_index - prd)
    if array.size(plval) > 1  // cleanup old ones
        for x = array.size(plloc) - 1 to 1 by 1
            if bar_index - array.get(plloc, x) > bo_len
                array.pop(plloc)
                array.pop(plval)

// check bullish cup
float bomax = na
int bostart = bar_index
num = 0
hgst = ta.highest(prd)[1]
if array.size(phval) >= mintest and close > open and close > hgst
    bomax := array.get(phval, 0)
    xx = 0
    for x = 0 to array.size(phval) - 1 by 1
        if array.get(phval, x) >= close
            break
        xx := x
        bomax := math.max(bomax, array.get(phval, x))
        bomax
    if xx >= mintest and open <= bomax
        for x = 0 to xx by 1
            if array.get(phval, x) <= bomax and array.get(phval, x) >= bomax - chwidth
                num += 1
                bostart := array.get(phloc, x)
                bostart
        if num < mintest or hgst >= bomax
            bomax := na
            bomax

// if not na(bomax) and num >= mintest
//     line.new(x1=bar_index, y1=bomax, x2=bostart, y2=bomax, color=bocolorup)
//     line.new(x1=bar_index, y1=bomax - chwidth, x2=bostart, y2=bomax - chwidth, color=bocolorup)
//     line.new(x1=bostart, y1=bomax - chwidth, x2=bostart, y2=bomax, color=bocolorup)
//     line.new(x1=bar_index, y1=bomax - chwidth, x2=bar_index, y2=bomax, color=bocolorup)

plotshape(not na(bomax) and num >= mintest, location=location.belowbar, style=shape.triangleup, color=bocolorup, size=size.small)
//alertcondition(not na(bomax) and num >= mintest, title='Breakout', message='Breakout')

// check bearish cup
float bomin = na
bostart := bar_index
num1 = 0
lwst = ta.lowest(prd)[1]
if array.size(plval) >= mintest and close < open and close < lwst
    bomin := array.get(plval, 0)
    xx = 0
    for x = 0 to array.size(plval) - 1 by 1
        if array.get(plval, x) <= close
            break
        xx := x
        bomin := math.min(bomin, array.get(plval, x))
        bomin
    if xx >= mintest and open >= bomin
        for x = 0 to xx by 1
            if array.get(plval, x) >= bomin and array.get(plval, x) <= bomin + chwidth
                num1 += 1
                bostart := array.get(plloc, x)
                bostart
        if num1 < mintest or lwst <= bomin
            bomin := na
            bomin

// if not na(bomin) and num1 >= mintest
//     line.new(x1=bar_index, y1=bomin, x2=bostart, y2=bomin, color=bocolordown)
//     line.new(x1=bar_index, y1=bomin + chwidth, x2=bostart, y2=bomin + chwidth, color=bocolordown)
//     line.new(x1=bostart, y1=bomin + chwidth, x2=bostart, y2=bomin, color=bocolordown)
//     line.new(x1=bar_index, y1=bomin + chwidth, x2=bar_index, y2=bomin, color=bocolordown)

plotshape(not na(bomin) and num1 >= mintest, location=location.abovebar, style=shape.triangledown, color=bocolordown, size=size.small)

//alertcondition(not na(bomin) and num1 >= mintest, title='Breakdown', message='Breakdown')
//alertcondition(not na(bomax) and num >= mintest or not na(bomin) and num1 >= mintest, title='Breakout or Breakdown', message='Breakout or Breakdown')

// Long Short conditions
longCondition = not na(bomax) and num >= mintest
if longCondition
    strategy.entry('Long', strategy.long)
shortCondition = not na(bomin) and num1 >= mintest
if shortCondition
    strategy.entry('Short', strategy.short)

// Entry price / Take Profit / Stop Loss
//entryprice = strategy.position_avg_price
entryprice = ta.valuewhen(condition=longCondition or shortCondition, source=close, occurrence=0)
pm = longCondition ? 1 : shortCondition ? -1 : 1 / math.sign(strategy.position_size)
takeprofit = entryprice * (1 + pm * tppercent * 0.01)
stoploss = entryprice * (1 - pm * slpercent * 0.01)
strategy.exit(id='Exit Long', from_entry='Long', stop=issl ? stoploss : na, limit=istp ? takeprofit : na, alert_message='Exit Long')
strategy.exit(id='Exit Short', from_entry='Short', stop=issl ? stoploss : na, limit=istp ? takeprofit : na, alert_message='Exit Short')
- RSI et MACD combiné stratégie longue courte
- Nuage d' Ichimoku et stratégie de moyenne mobile
- William Alligator Stratégie de capteur de tendance moyenne mobile
- Dynamique MACD et stratégie de négociation dans le cloud Ichimoku
- Stratégie de rejet de la MA avec filtre ADX
- Stratégie Bollinger Bands: négociation de précision pour des gains maximaux
- Stratégie de rupture moyenne ATR
- Stratégie d'apprentissage automatique KNN: Système de trading de prédiction de tendance basé sur l'algorithme K-Nearest Neighbors
- La valeur de l'échange est la valeur de l'échange à l'échelle de l'échange.
- Stratégie de rupture du BMSB
- Stratégie de rupture dynamique des bandes de Bollinger
- 8 heures de travail
- RSI Stratégie de négociation quantitative
- La tendance ATR de la bande de Bollinger suivant la stratégie
- Stratégie de négociation du volume delta avec les niveaux de Fibonacci
- Stratégie différentielle RSI double
- Stratégie RSI stochastique pour les crypto-monnaies
- Indice de force relative triple Stratégie de négociation quantitative
- Stratégie d'optimisation MACD double combinant le suivi de tendance et le trading dynamique
- Stratégie de négociation basée sur trois bougies baissières consécutives et deux moyennes mobiles