一云多均线交易策略
Author: ChaoZhang, Date: 2024-05-17 10:55:29Tags: MASMAICHIMOKU

概述
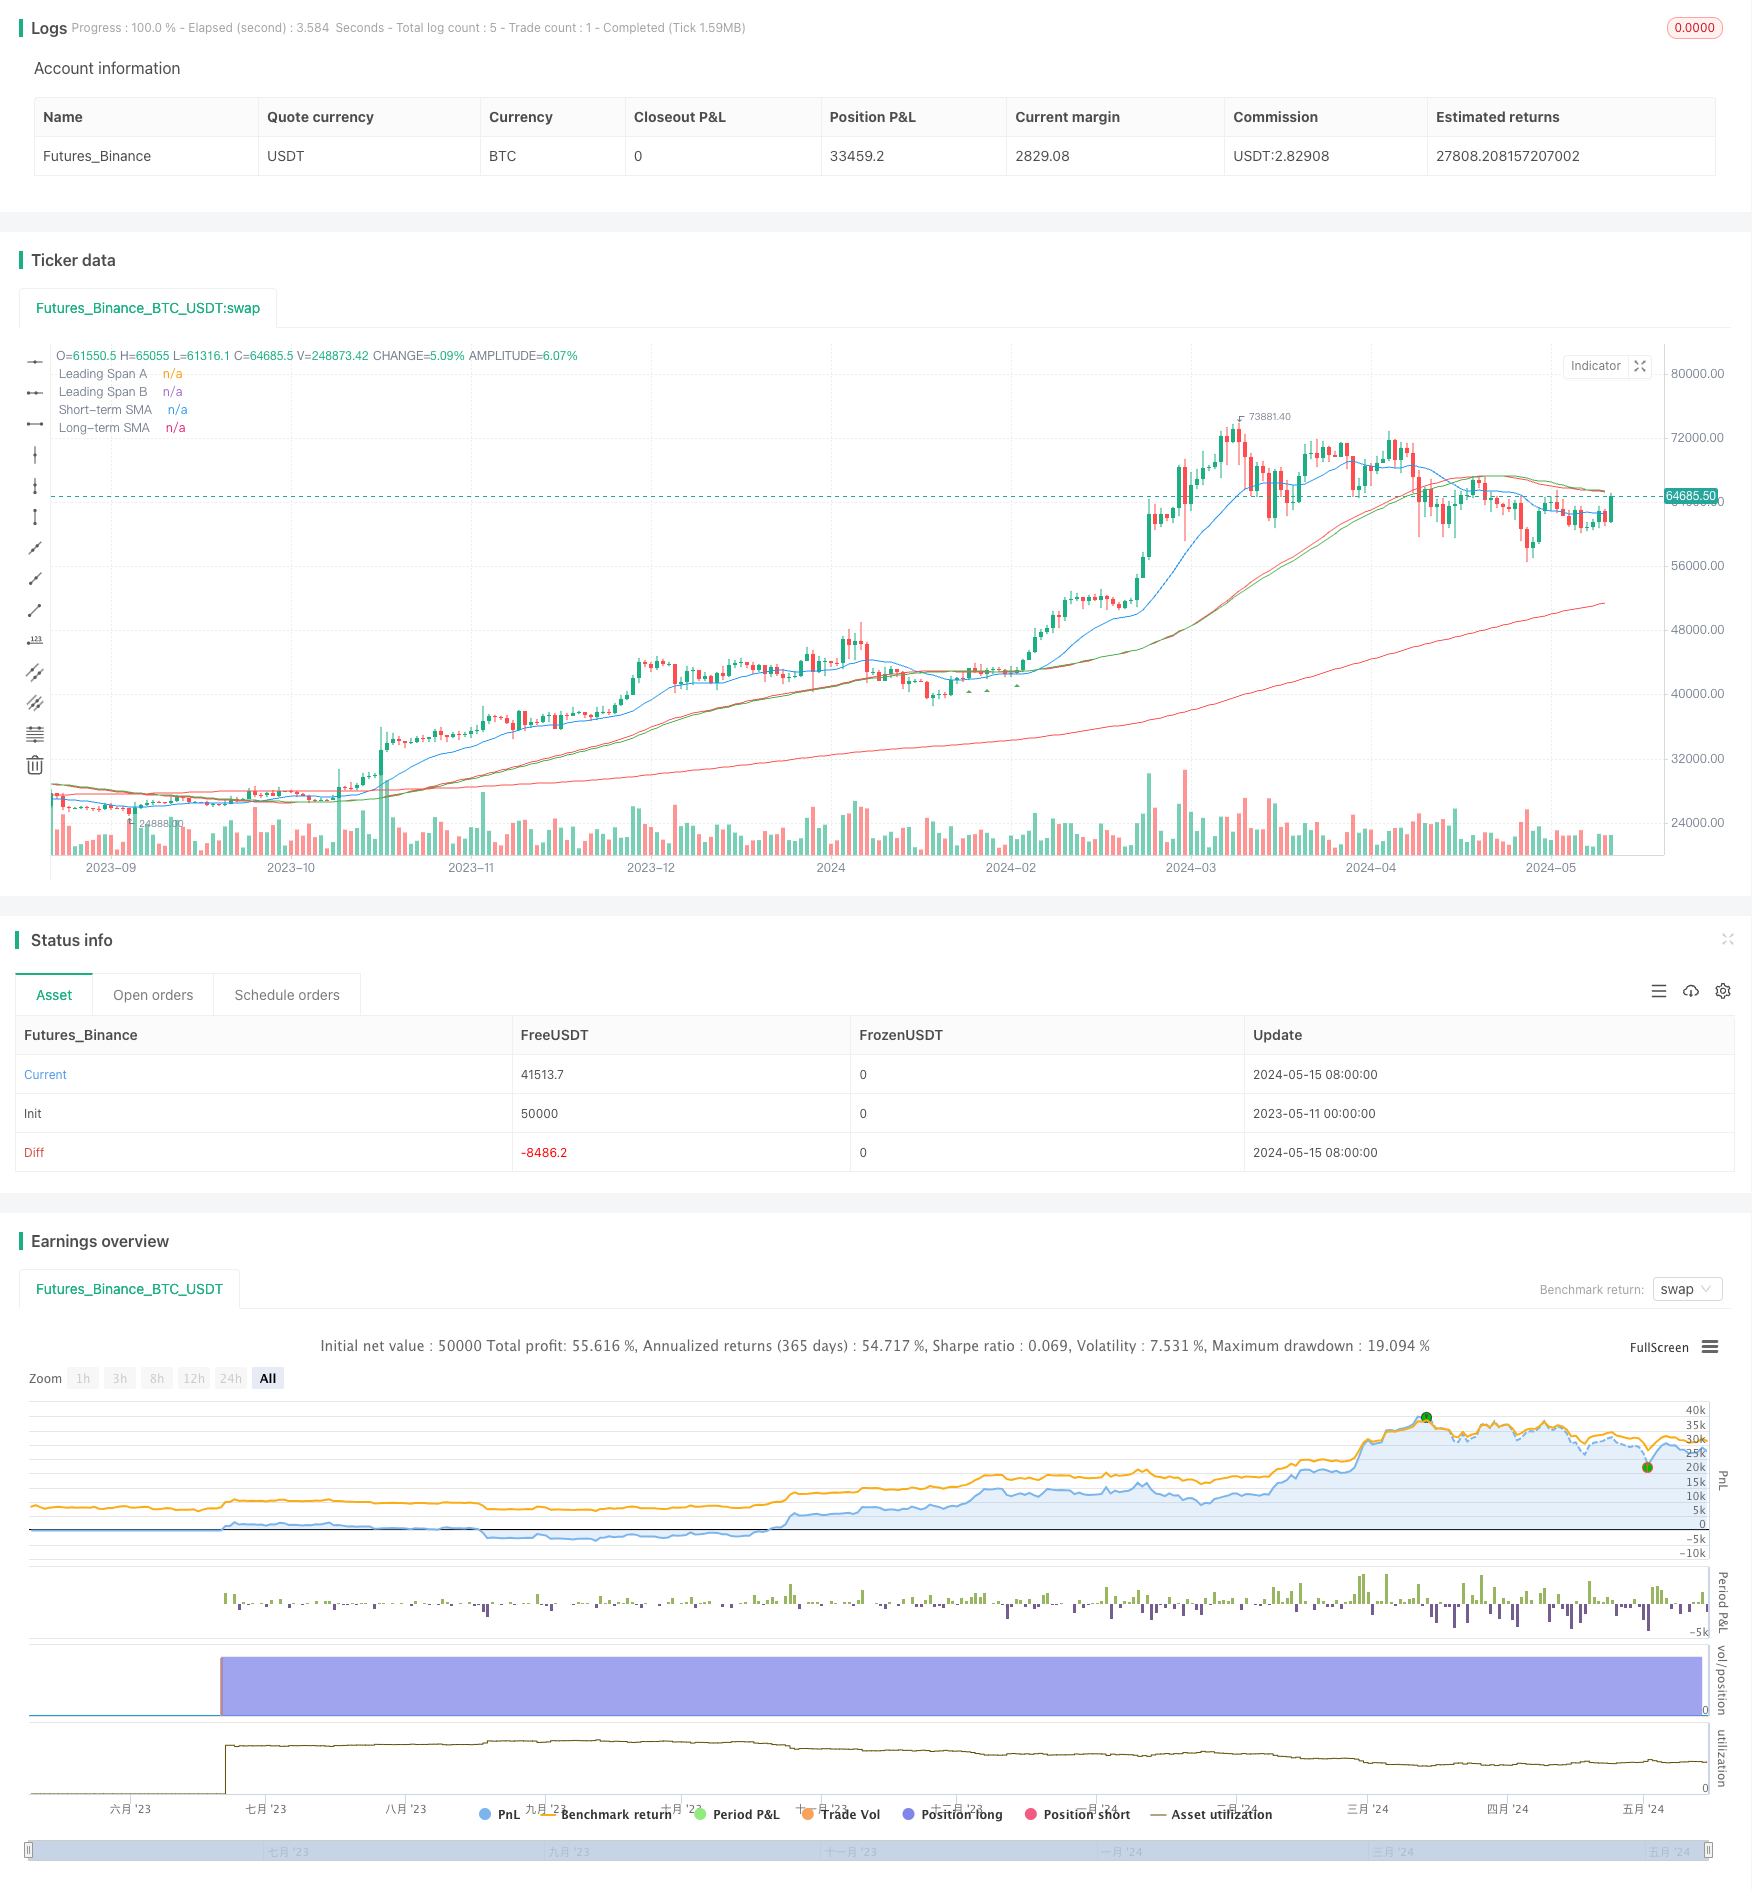
该策略结合了一目均衡图云以及短期(55)和长期(200)简单移动平均线(SMA)来识别潜在的买卖信号。买入信号需要价格高于云层和长期SMA,并在上穿短期SMA后回踩短期SMA。卖出信号需要价格低于云层和长期SMA,并在下穿短期SMA后回踩短期SMA。该策略避免在横盘市或重大新闻事件期间产生信号,因为这些时期虚假信号较多。回测表明该策略在1小时和2小时时间框架上表现最佳。
策略原理
该策略基于以下原则: 1. 当价格高于云层和长期SMA时,市场处于上升趋势。 2. 当价格低于云层和长期SMA时,市场处于下降趋势。 3. 短期SMA的上穿和下穿可以确认趋势,回踩短期SMA提供低风险入场机会。 4. 横盘市和重大新闻事件期间虚假信号较多,应该避免交易。
程序首先计算所需的一目云组件(转换线、基准线、先行span A和B),以及短期和长期SMA。然后定义多个条件来识别价格相对于云层和均线的位置。当满足所有买入/卖出条件时,程序分别产生买入和卖出信号。
策略优势
- 结合多个指标确认趋势,提高信号可靠性。一目云能过滤掉很多噪音,SMA交叉能确认趋势。
- 在已确认的趋势中寻找回踩均线的入场机会,风险相对较低。
- 通过避免横盘市和重大新闻事件期间交易,进一步降低虚假信号风险。
- 适用于1小时和2小时等中长期交易,把握大趋势利润空间大。
策略风险
- 在趋势转折期可能会发生亏损。虽然均线交叉和云层突破能确认趋势,但滞后性仍然存在。
- 缺乏明确的止损位置。现有条件主要关注入场时机,但没有定义具体离场位置。
- 参数选择具有主观性和不确定性。云层参数、均线长度等的不同选择会影响策略表现。
策略优化方向
- 加入明确的止损位置,比如突破前低/前高、ATR倍数等,以降低单次交易风险。
- 对照其他趋势确认指标,如MACD、DMI等,形成更加稳健可靠的信号组合。
- 针对参数进行优化,找到最佳参数组合,提高策略在各种市场状态下的适应性。
- 区分趋势和震荡市,在趋势市中积极入场,震荡市中则适当降低交易频率。
总结
该”一云多均线交易策略”通过结合一目均衡图云和简单移动平均线,在已确立的趋势中寻找回踩均线的低风险入场机会。通过过滤掉横盘市和重大新闻事件期间的交易,该策略能够降低虚假信号风险,从而提高整体表现。策略主要适用于中长期交易者,在1小时和2小时等时间框架上表现良好。但该策略仍有进一步优化空间,如引入明确止损位、优化信号组合、对参数进行调试等,以期获得更加稳健的策略表现。
/*backtest
start: 2023-05-11 00:00:00
end: 2024-05-16 00:00:00
period: 1d
basePeriod: 1h
exchanges: [{"eid":"Futures_Binance","currency":"BTC_USDT"}]
*/

//@version=5
strategy("Ichimoku Cloud and Moving Average Strategy", shorttitle="ICMA", overlay=true)

// Input parameters
shortMA = input.int(55, title="Short-term Moving Average Length")
longMA = input.int(200, title="Long-term Moving Average Length")

// Calculate moving averages
shortSMA = ta.sma(close, shortMA)
longSMA = ta.sma(close, longMA)

// Ichimoku Cloud settings
conversionPeriod = input.int(9, title="Conversion Line Period")
basePeriod = input.int(26, title="Base Line Period")
spanBPeriod = input.int(52, title="Span B Period")
displacement = input.int(26, title="Displacement")

// Calculate Ichimoku Cloud components
conversionLine = ta.sma(high + low, conversionPeriod) / 2
baseLine = ta.sma(high + low, basePeriod) / 2
leadSpanA = (conversionLine + baseLine) / 2
leadSpanB = ta.sma(high + low, spanBPeriod) / 2

// Plot Ichimoku Cloud components
plot(leadSpanA, color=color.blue, title="Leading Span A")
plot(leadSpanB, color=color.red, title="Leading Span B")

// Entry conditions
aboveCloud = close > leadSpanA and close > leadSpanB
belowCloud = close < leadSpanA and close < leadSpanB
aboveShortMA = close > shortSMA
aboveLongMA = close > longSMA
belowShortMA = close < shortSMA
belowLongMA = close < longSMA

// Buy condition (Price retests 55 moving average after being above it)
buyCondition = aboveCloud and aboveLongMA and close[1] < shortSMA and close > shortSMA

// Sell condition (Price retests 55 moving average after being below it)
sellCondition = belowCloud and belowLongMA and close[1] > shortSMA and close < shortSMA

// Strategy entry and exit
strategy.entry("Buy", strategy.long, when = buyCondition)
strategy.entry("Sell", strategy.short, when = sellCondition)

// Plot moving averages
plot(shortSMA, color=color.green, title="Short-term SMA")
plot(longSMA, color=color.red, title="Long-term SMA")

// Plot buy and sell signals
plotshape(series=buyCondition, style=shape.triangleup, location=location.belowbar, color=color.green, size=size.small, title="Buy Signal")
plotshape(series=sellCondition, style=shape.triangledown, location=location.abovebar, color=color.red, size=size.small, title="Sell Signal")
相关内容
- 均线,简单移动平均线,均线斜率,追踪止损,重新进场
- 随机震荡指标与均线交叉策略结合止损与随机震荡过滤器
- 双均线交叉动态持仓策略
- 移动平均交叉策略
- SMA双均线交易策略
- 移动平均线交叉策略
- 基于多均线的趋势交易策略
- 趋势捕捉策略
- 双均线交叉自适应参数择时交易策略
- 基于双均线交叉的移动平均线策略
更多内容
- 逆向波动率突破策略
- Nifty50三分钟开盘价突破策略
- 布林带动态止损止盈策略
- 改进型多空转换K线形态突破策略
- Laguerre RSI与ADX滤波交易信号策略
- 价量突破买入策略
- K线连续数目牛熊判断策略
- 超级均线与Upperband交叉策略
- 基于RSI、ADX和一目均衡图的多因子趋势跟踪量化交易策略
- RSI与MACD结合的多空策略
- 威廉鳄鱼均线趋势捕捉策略
- 动态MACD和一目均衡图交易策略
- 基于平均方向指数过滤器的均线拒绝策略
- Bollinger Bands 布林带策略:精准交易,实现最大收益
- ATR均线突破策略
- KNN 机器学习策略:基于 K 近邻算法的趋势预测交易系统
- CCI+RSI+KC趋势滤波多空双向交易策略
- BMSB 突破策略
- SR 突破策略
- 动态布林带突破策略