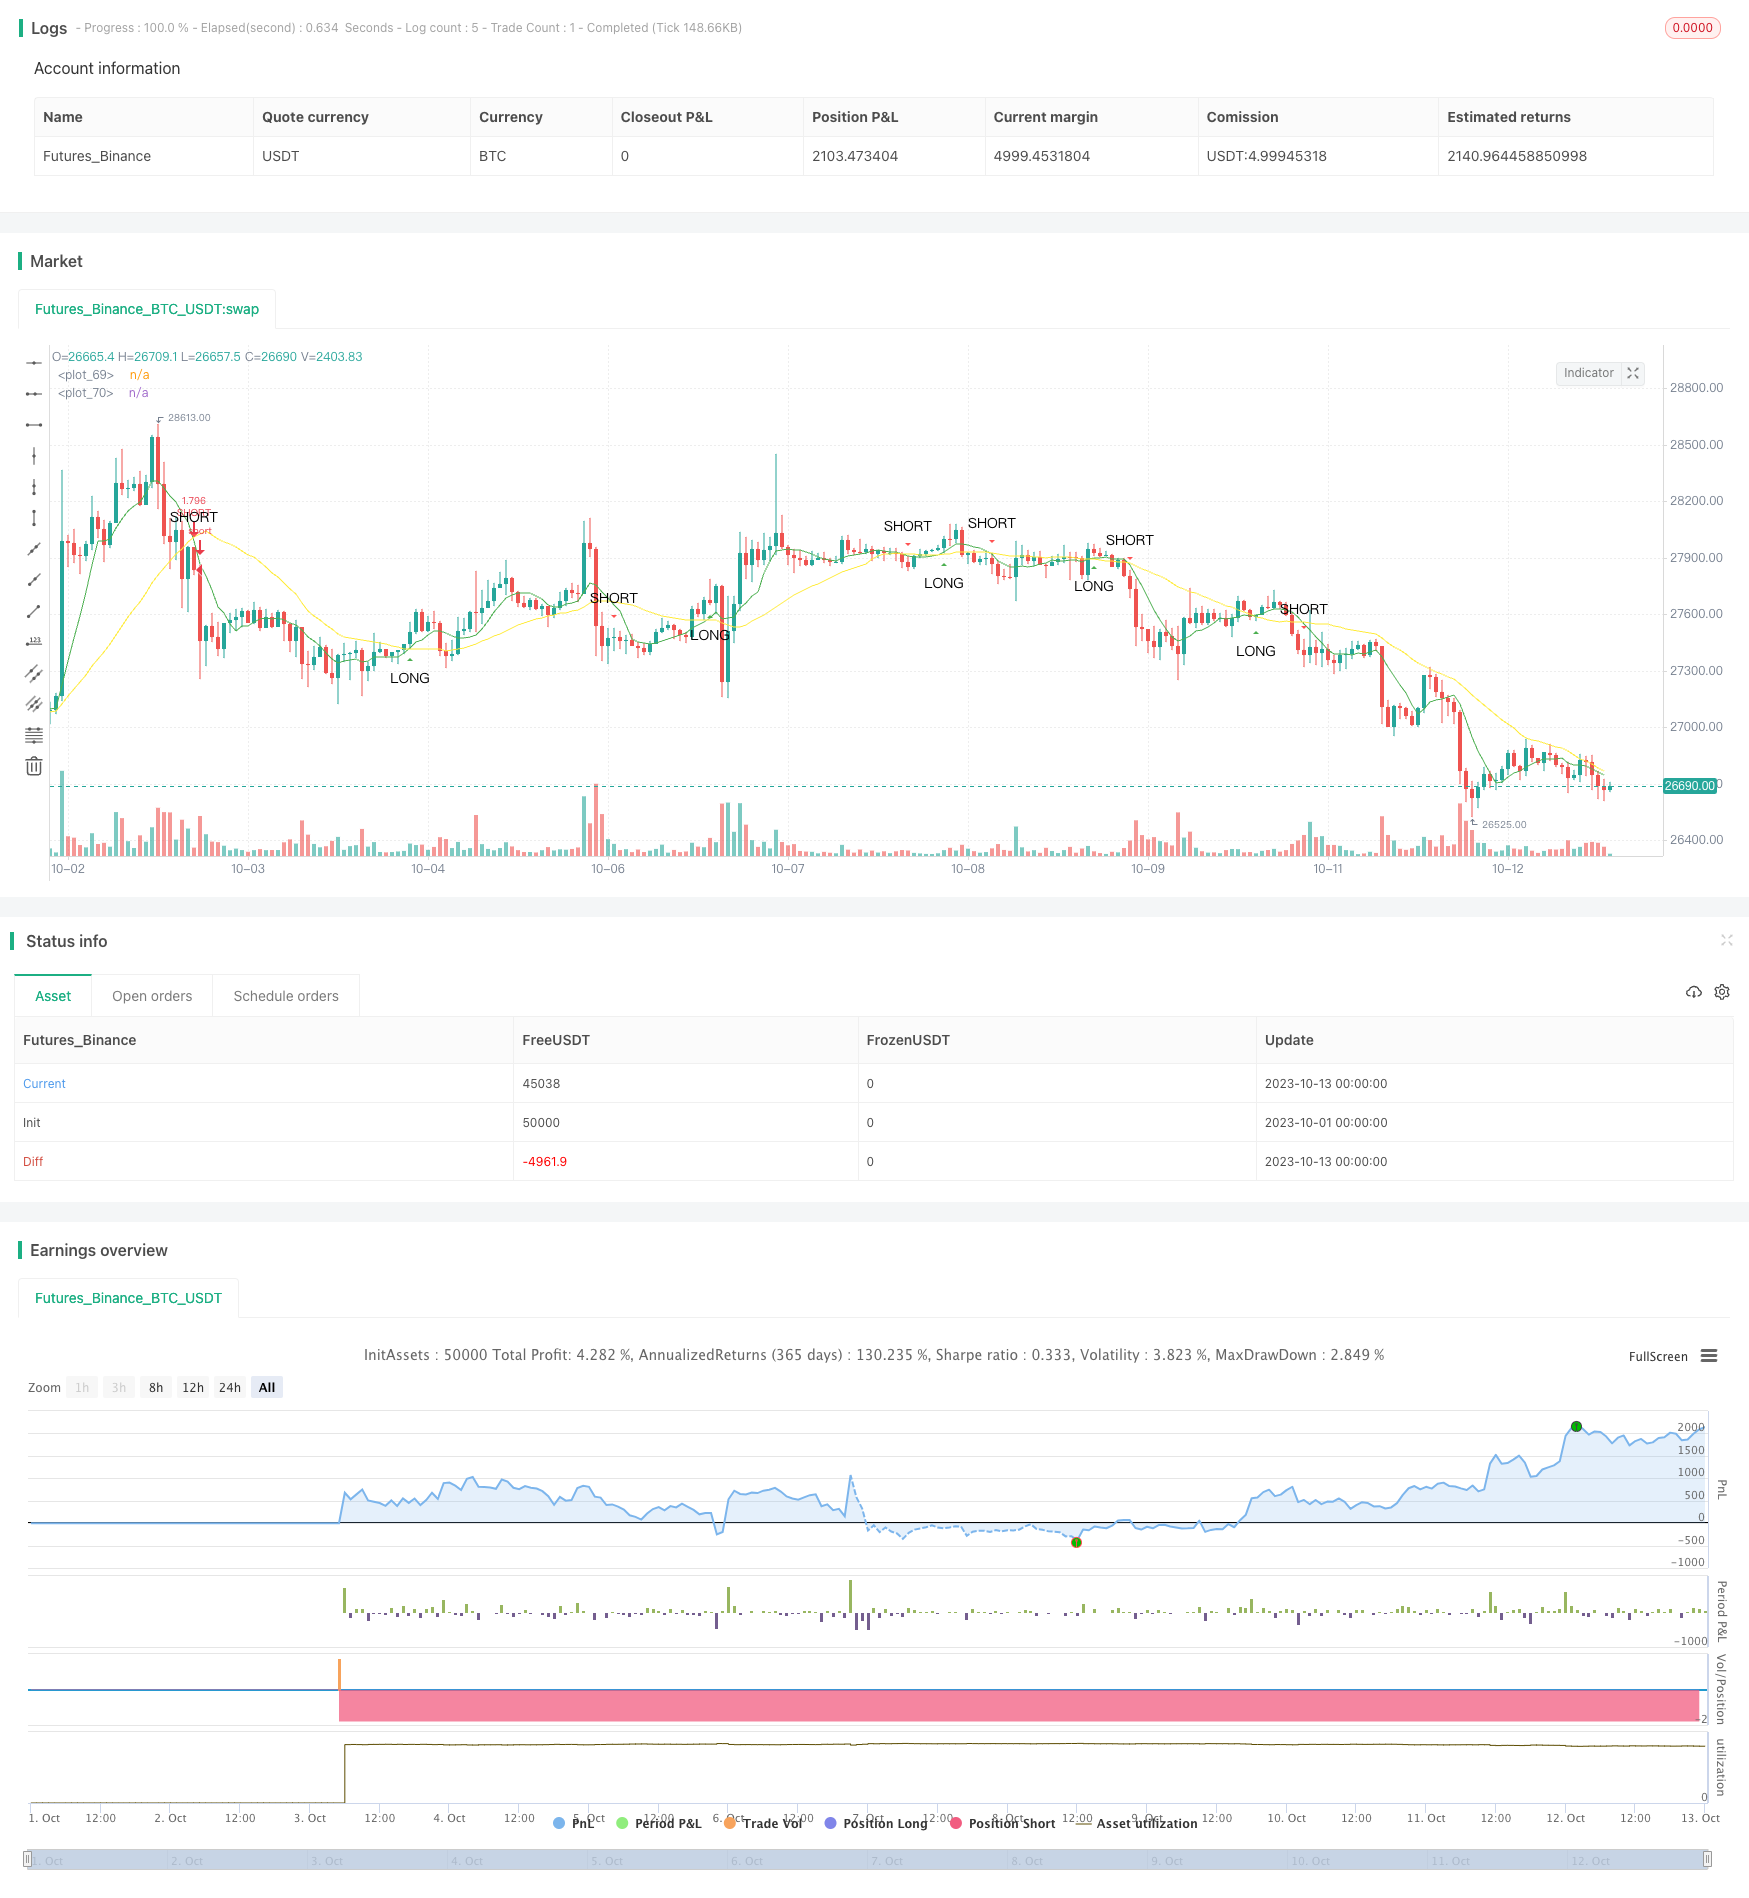
एसएमए क्रॉसओवर रणनीति

अवलोकन
यह रणनीति तेजी से चलती औसत और धीमी गति से चलती औसत के एक क्रॉसिंग सिद्धांत पर आधारित है जो एक व्यापार संकेत उत्पन्न करती है। जब तेजी से चलती औसत नीचे से धीमी गति से चलती औसत को पार करता है, तो एक खरीद संकेत उत्पन्न होता है; जब तेजी से चलती औसत ऊपर से नीचे से धीमी गति से चलती औसत को पार करता है, तो एक बेचने का संकेत उत्पन्न होता है।
सिद्धांत
इस रणनीति का उपयोग करता है स्मा फ़ंक्शन की गणना करने के लिए तेजी से चलती औसत और धीमी गति से चलती औसत. में fast_SMA तेजी से चलती औसत है, और चक्र लंबाई fast_SMA_input है; धीमी गति से चलती औसत धीमी गति से_SMA_input है।
रणनीति क्रॉस और क्रॉसंडर फ़ंक्शंस का उपयोग करती है ताकि यह पता लगाया जा सके कि क्या एक तेज चलती औसत और एक धीमी चलती औसत का क्रॉसिंग है। जब एक तेज चलती औसत पर एक धीमी चलती औसत होता है, तो LONG चर सही होता है, एक खरीद संकेत उत्पन्न करता है; जब एक तेज चलती औसत के नीचे एक धीमी चलती औसत होता है, तो SHORT चर सही होता है, एक बेचने का संकेत उत्पन्न करता है।
श्रेष्ठता विश्लेषण
इस रणनीति के निम्नलिखित फायदे हैं:
- रणनीति सरल है, इसे समझना और लागू करना आसान है।
- अलग-अलग बाजार स्थितियों के लिए अनुकूलन योग्य चलती औसत चक्र
- कुछ बाजारों के शोर को फ़िल्टर करके, अधिक विश्वसनीय ट्रेडिंग सिग्नल का उत्पादन किया जा सकता है
- यह एक ही समय में प्रवृत्ति की शुरुआत और बदलाव को पकड़ सकता है।
जोखिम विश्लेषण
इस रणनीति के साथ निम्नलिखित जोखिम भी हैं:
- यदि यह गलत तरीके से सेट किया जाता है, तो बहुत अधिक ट्रेडिंग सिग्नल उत्पन्न होते हैं, जिससे ट्रेडिंग की आवृत्ति होती है।
- इस तरह के संकेतों से बाजारों में भारी मात्रा में अमान्य संकेत मिल सकते हैं।
- इस प्रकार, यह अनुमान लगाया जा सकता है कि इस प्रवृत्ति में कोई बदलाव नहीं होगा, और यह बहुत जल्दी हो सकता है।
जोखिम नियंत्रण विधि:
- फ़िल्टरिंग प्रभाव और संवेदनशीलता को संतुलित करने के लिए उचित चलती औसत पैरामीटर सेट करें।
- प्रवृत्ति सूचक फ़िल्टर के साथ संयुक्त संकेत अमान्य।
- स्टॉप लॉस सेट करें और एकल नुकसान को नियंत्रित करें।
अनुकूलन दिशा
इस रणनीति को निम्नलिखित पहलुओं से अनुकूलित किया जा सकता हैः
- फ़िल्टरिंग की स्थिति को बढ़ाएं, और झूठी दरारों से बचने के लिए चलती औसत को तोड़ने पर लेनदेन या अस्थिरता के संकेतकों की जांच करें।
- प्रवृत्ति के संकेतकों के साथ, प्रवृत्ति की दिशा और ताकत की पहचान करें।
- मशीन लर्निंग मॉडल को जोड़ना, स्वचालित रूप से चलती औसत पैरामीटर का अनुकूलन करना।
- तकनीकी संकेतकों जैसे कि समर्थन प्रतिरोध बिंदु, ब्रिन बैंड और अन्य के साथ व्यापार क्षेत्र के मानचित्रण के साथ, प्रवेश की सटीकता में सुधार करना।
संक्षेप
इस रणनीति का लाभ उठाने के लिए सरल और प्रभावी ढंग से व्यापार संकेत उत्पन्न करने के लिए चलती औसत. हालांकि कुछ जोखिम है, लेकिन यह पैरामीटर अनुकूलन, फिल्टर शर्तों को जोड़ने आदि के माध्यम से सुधार किया जा सकता है. चलती औसत क्रॉसिंग रणनीति आगे के अध्ययन और आवेदन के लायक है.
/*backtest
start: 2023-10-01 00:00:00
end: 2023-10-13 00:00:59
period: 1h
basePeriod: 15m
exchanges: [{"eid":"Futures_Binance","currency":"BTC_USDT"}]
*/

//@author Jacques Grobler
//
//                  SIMPLE CROSS OVER BOT
//                  =====================
//
// This is a simple example of how to set up a strategy to go long or short
// If you make any modifications or have any suggestions, let me know
// When using this script, every section marked back testing should be
// uncommented in order to use for back testing, same goes for using the script portion

///////////////////////////////////////////////////////////////////////////////////////
//// INTRO
//// -----
// BACKTESTING
//@version=4
strategy(title="SimpleCrossOver_Bot_V1_Backtester", overlay=true, default_qty_type=strategy.percent_of_equity, default_qty_value=100, pyramiding=0, commission_type=strategy.commission.percent, commission_value=0.1)

// SIGNALS
//study(title="SimpleCrossOver_Bot_V1_Signals", overlay = true)

///////////////////////////////////////////////////////////////////////////////////////
//// INPUTS
//// ------
// BACKTESTING
dateSart_Year = input(2018, title="Start Year", minval=2000)
dateSart_Month = input(1, title="Start Month", minval=1, maxval=12)
dateSart_Day = input(1, title="Start Day", minval=1, maxval=31)
dateEnd_Year = input(2019, title="End Year", minval=2000)
dateEnd_Month = input(1, title="End Month", minval=1, maxval=12)
dateEnd_Day = input(1, title="End Day", minval=1, maxval=31)

// BACKTESTING AND SIGNALS
fast_SMA_input = input(7, title="SMA Fast")
slow_SMA_input = input(25, title="SMA Slow")

///////////////////////////////////////////////////////////////////////////////////////
//// INDICATORS
//// ----------
fast_SMA = sma(close, fast_SMA_input)
slow_SMA = sma(close, slow_SMA_input)

///////////////////////////////////////////////////////////////////////////////////////
//// STRATEGY
//// --------
LONG = cross(fast_SMA, slow_SMA) and fast_SMA > slow_SMA
stratLONG() => crossover(fast_SMA, slow_SMA)
SHORT = cross(fast_SMA, slow_SMA) and fast_SMA < slow_SMA
stratSHORT() => crossunder(fast_SMA, slow_SMA)

///////////////////////////////////////////////////////////////////////////////////////
//// TRIGGERS
//// --------
// BACKTESTING
testPeriodStart = timestamp(dateSart_Year, dateSart_Month, dateSart_Day, 0, 0)
testPeriodStop = timestamp(dateEnd_Year, dateEnd_Month, dateEnd_Day, 0, 0)
timecondition = true

strategy.entry(id="LONG", long = true, when=timecondition and stratLONG())
strategy.entry(id="SHORT", long = false, when=timecondition and stratSHORT())

// SIGNALS
//alertcondition(LONG, title="LONG")
//alertcondition(SHORT, title="SHORT")

///////////////////////////////////////////////////////////////////////////////////////
//// PLOTS
//// -----
// BACKTESTING AND SIGNALS
plot(fast_SMA, color=green, linewidth=1)
plot(slow_SMA, color=yellow, linewidth=1)
plotshape(LONG, title="LONG", style=shape.triangleup, text="LONG", location=location.belowbar, size=size.small, color=green)
plotshape(SHORT, title="SHORT", style=shape.triangledown, text="SHORT", location=location.abovebar, size=size.small, color=red)