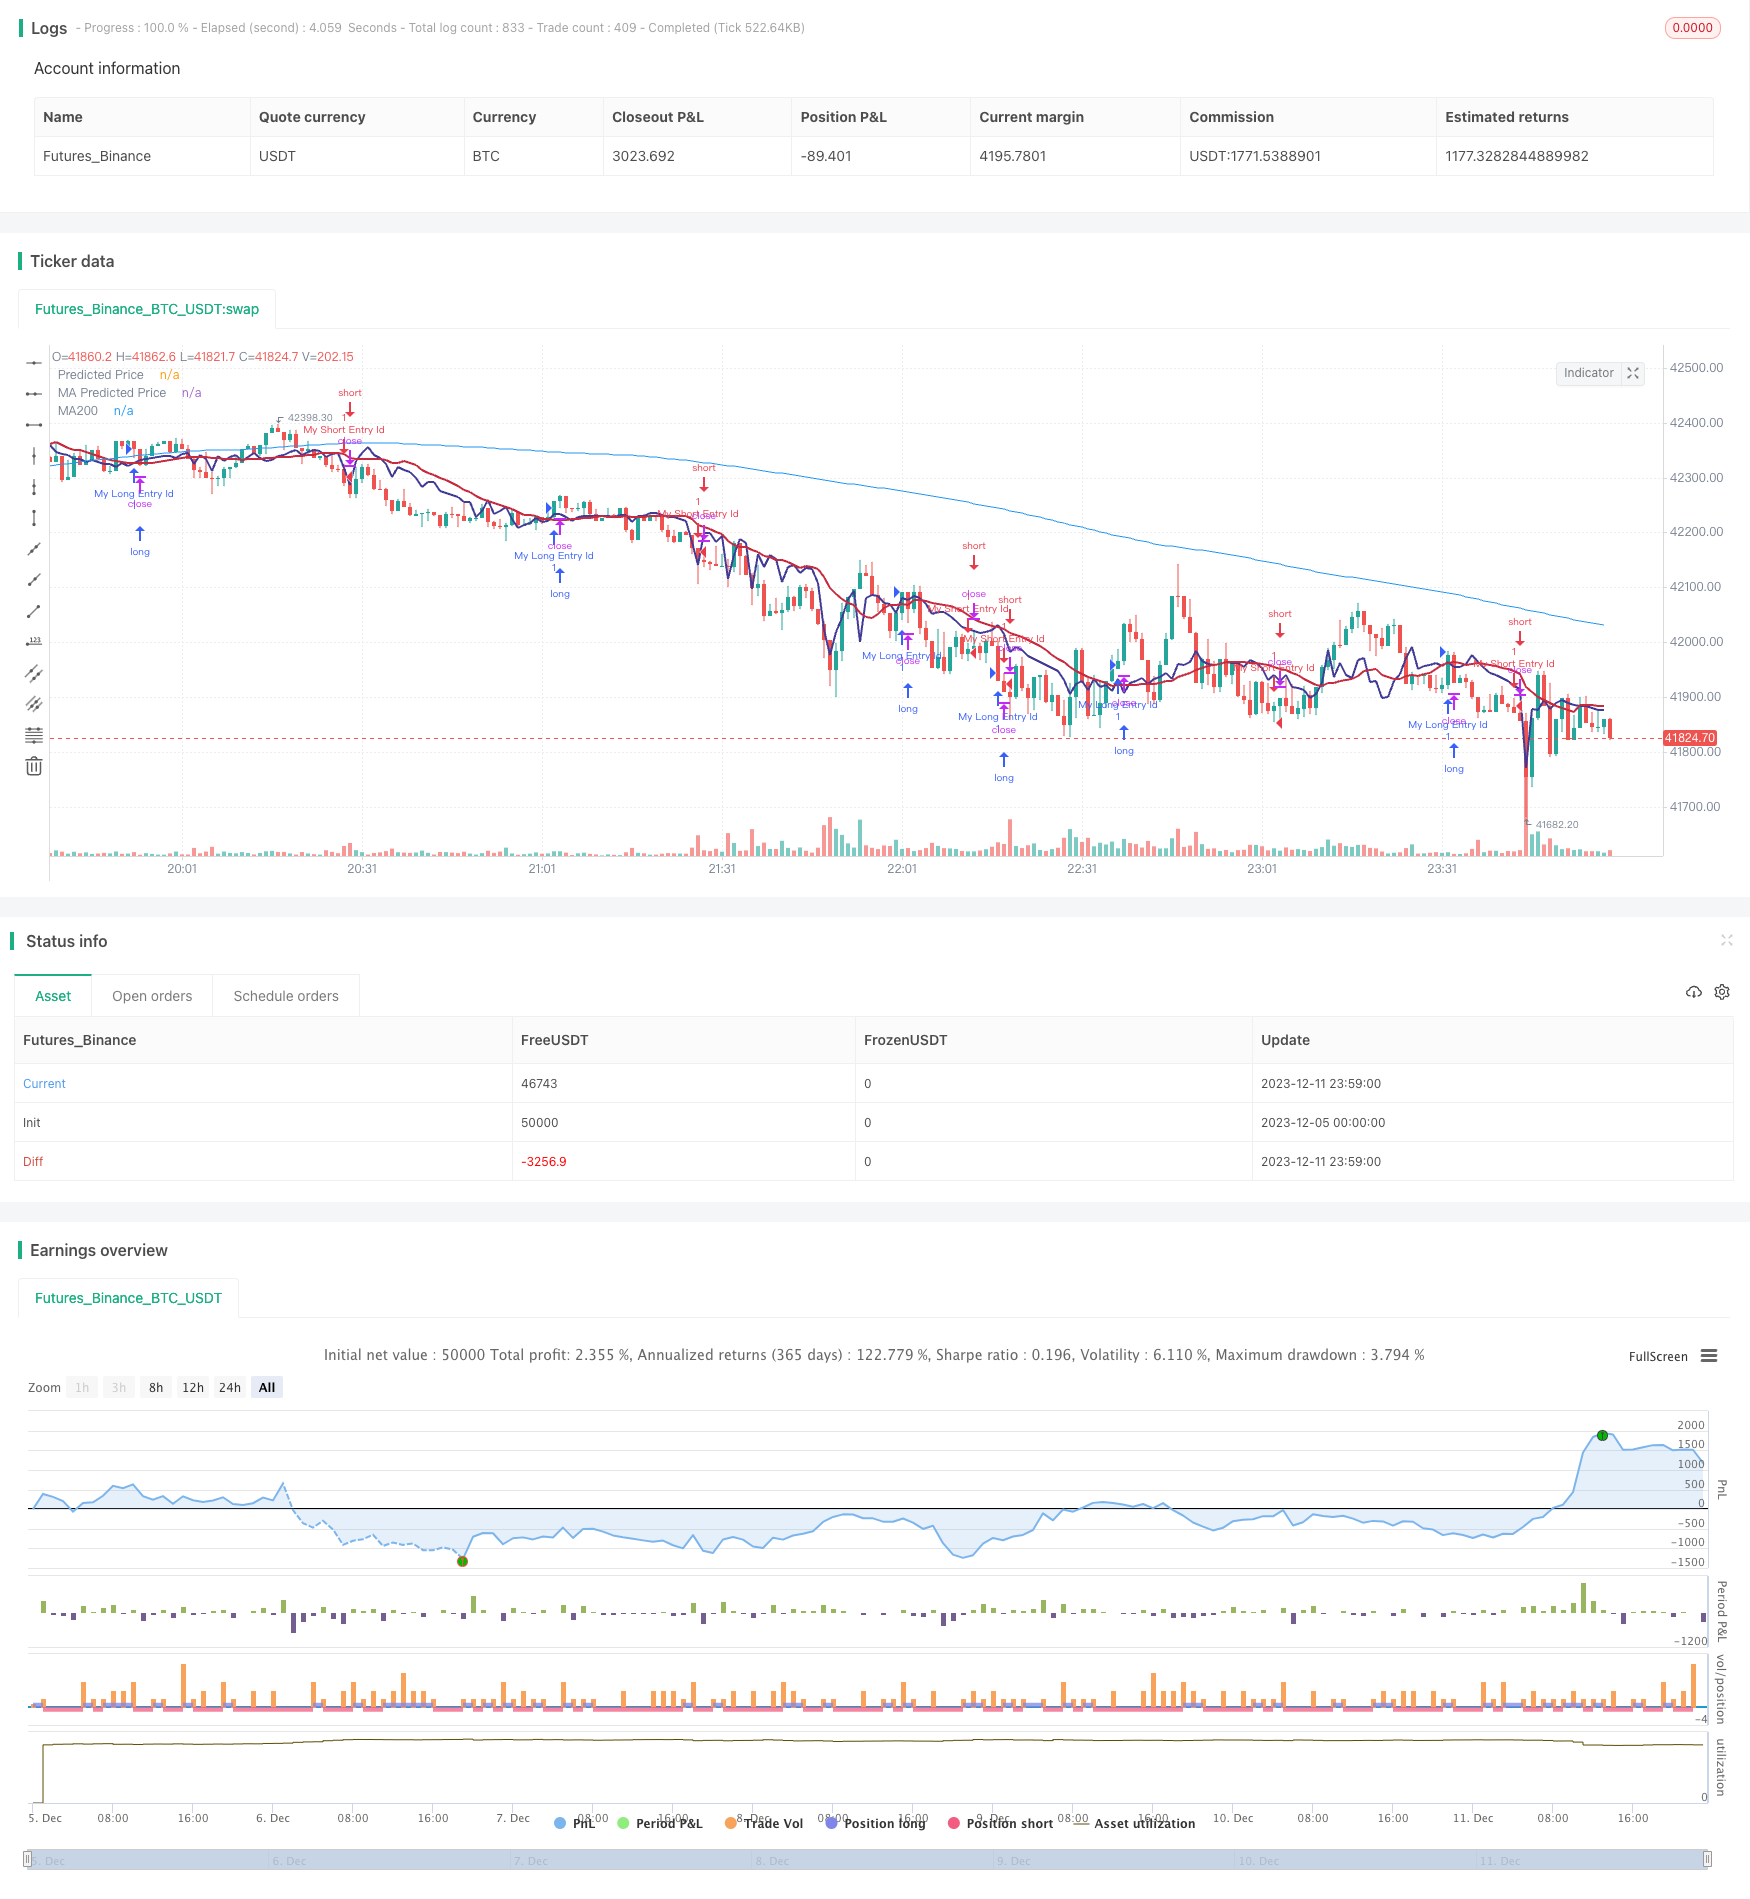
गतिशील वैचारिक प्रवृत्ति उलट रणनीति

अवलोकन
गतिशील विचारधारा ट्रेंड रिवर्स रणनीतियाँ मूल्य पूर्वानुमान के लिए एक रैखिक वापसी का उपयोग करती हैं और ट्रेडिंग सिग्नल उत्पन्न करने के लिए मूविंग एवरेज के गठन के साथ विचारधारा का उपयोग करती हैं। जब पूर्वानुमानित मूल्य नीचे से ऊपर की ओर से मूविंग एवरेज को पार करता है तो एक खरीद संकेत उत्पन्न होता है; जब पूर्वानुमानित मूल्य ऊपर से नीचे की ओर से मूविंग एवरेज को पार करता है तो एक बेचने का संकेत उत्पन्न होता है, जो प्रवृत्ति के उलट को पकड़ने के लिए होता है।
रणनीति सिद्धांत
- लेनदेन की मात्रा के आधार पर शेयर की कीमत की गणना के लिए रैखिक वापसी, कीमत का अनुमानित मूल्य प्राप्त करें
- विभिन्न स्थितियों में चलती औसत की गणना करना
- जब पूर्वानुमानित कीमतें नीचे से ऊपर की ओर चलती औसत को पार करती हैं, तो एक खरीद संकेत उत्पन्न होता है
- जब पूर्वानुमानित कीमतें ऊपर से नीचे की ओर चलती औसत को पार करती हैं, तो एक बेचने का संकेत उत्पन्न होता है
- एमएसीडी सूचकांक के साथ प्रवृत्ति में बदलाव का समय
उपरोक्त सिग्नल में कई प्रकार के कन्फर्मेशन शामिल हैं, जिससे झूठे ब्रेक से बचा जा सकता है, जिससे सिग्नल की सटीकता बढ़ जाती है।
श्रेष्ठता विश्लेषण
- मूल्य प्रवृत्तियों की भविष्यवाणी के लिए रैखिक प्रतिगमन का उपयोग करके संकेत की सटीकता में सुधार
- मूविंग एवरेज के साथ एक विचारधारा, एक प्रवृत्ति को पकड़ने के लिए
- लेनदेन की मात्रा पर आधारित रैखिक प्रतिगमन, अधिक आर्थिक रूप से समझ में आता है
- MACD जैसे संकेतकों के साथ कई पुष्टि करें, झूठे संकेतों को कम करें
जोखिम विश्लेषण
- रैखिक प्रतिगमन के लिए पैरामीटर सेटिंग परिणामों पर बहुत प्रभाव डालती है
- चलती औसत सेटिंग भी सिग्नल की गुणवत्ता को प्रभावित करती है
- हालांकि पुष्टि तंत्र है, फिर भी झूठे संकेतों का खतरा है
- कोड को और अधिक अनुकूलित किया जा सकता है ताकि ट्रेडों की संख्या कम हो और मुनाफे में वृद्धि हो
अनुकूलन दिशा
- रैखिक प्रतिगमन और चलती औसत के लिए पैरामीटर का अनुकूलन
- पुष्टि की शर्तों को बढ़ाएं और झूठे संकेतों को कम करें
- गुणवत्ता में बदलाव के लिए और अधिक कारक
- एकल लेनदेन जोखिम को कम करने के लिए स्टॉप लॉस रणनीति का अनुकूलन करें
संक्षेप
गतिशील विचारधारा प्रवृत्ति उलटा रणनीति एक विचारधारा है जिसमें रैखिक रिटर्न पूर्वानुमान और चलती औसत का गठन होता है, जो प्रवृत्ति के पलटने के समय को पकड़ता है। एक एकल संकेतक की तुलना में उच्च विश्वसनीयता है। साथ ही, रणनीति को पैरामीटर समायोजन और पुष्टि की शर्तों के अनुकूलन के माध्यम से संकेत की गुणवत्ता और मुनाफे के स्तर को और बढ़ाया जा सकता है।
/*backtest
start: 2023-12-05 00:00:00
end: 2023-12-12 00:00:00
period: 1m
basePeriod: 1m
exchanges: [{"eid":"Futures_Binance","currency":"BTC_USDT"}]
*/

// This source code is subject to the terms of the Mozilla Public License 2.0 at https://mozilla.org/MPL/2.0/
// © stocktechbot
//@version=5
strategy("Linear Cross", overlay=true, margin_long=100, margin_short=0)

//Linear Regression

vol = volume

// Function to calculate linear regression
linregs(y, x, len) =>
    ybar = math.sum(y, len)/len
    xbar = math.sum(x, len)/len
    b = math.sum((x - xbar)*(y - ybar),len)/math.sum((x - xbar)*(x - xbar),len)
    a = ybar - b*xbar
    [a, b]

// Historical stock price data
price = close

// Length of linear regression
len = input(defval = 21, title = 'Strategy Length')
linearlen=input(defval = 9, title = 'Linear Lookback')
[a, b] = linregs(price, vol, len)

// Calculate linear regression for stock price based on volume
//eps = request.earnings(syminfo.ticker, earnings.actual)
//MA For double confirmation

out = ta.sma(close, 200)
outf = ta.sma(close, 50)
outn = ta.sma(close, 90)
outt = ta.sma(close, 21)
outthree = ta.sma(close, 9)

// Predicted stock price based on volume
predicted_price = a + b*vol

// Check if predicted price is between open and close
is_between = open < predicted_price and predicted_price < close

//MACD
//[macdLine, signalLine, histLine] = ta.macd(close, 12, 26, 9)

// Plot predicted stock price
plot(predicted_price, color=color.rgb(65, 59, 150), linewidth=2, title="Predicted Price")
plot(ta.sma(predicted_price,linearlen), color=color.rgb(199, 43, 64), linewidth=2, title="MA Predicted Price")
//offset = input.int(title="Offset", defval=0, minval=-500, maxval=500)
plot(out, color=color.blue, title="MA200")
[macdLine, signalLine, histLine] = ta.macd(predicted_price, 12, 26, 9)

//BUY Signal

longCondition=false
mafentry =ta.sma(close, 50) > ta.sma(close, 90)
//matentry = ta.sma(close, 21) > ta.sma(close, 50)
matwohun = close > ta.sma(close, 200)
twohunraise = ta.rising(out, 2)
twentyrise = ta.rising(outt, 2)
macdrise = ta.rising(macdLine,2)
macdlong = ta.crossover(predicted_price, ta.wma(predicted_price,linearlen))  and (signalLine < macdLine)
if macdlong and macdrise
    longCondition := true

if (longCondition)
    strategy.entry("My Long Entry Id", strategy.long)
//Sell Signal
lastEntryPrice = strategy.opentrades.entry_price(strategy.opentrades - 1)
daysSinceEntry = len
daysSinceEntry := int((time - strategy.opentrades.entry_time(strategy.opentrades - 1)) / (24 * 60 * 60 * 1000))
percentageChange = (close - lastEntryPrice) / lastEntryPrice * 100
//trailChange = (ta.highest(close,daysSinceEntry) - close) / close * 100

//label.new(bar_index, high, color=color.black, textcolor=color.white,text=str.tostring(int(trailChange)))
shortCondition=false
mafexit =ta.sma(close, 50) < ta.sma(close, 90)
matexit = ta.sma(close, 21) < ta.sma(close, 50)
matwohund = close < ta.sma(close, 200)
twohunfall = ta.falling(out, 3)
twentyfall = ta.falling(outt, 2)
shortmafall = ta.falling(outthree, 1)
macdfall = ta.falling(macdLine,1)
macdsell = macdLine < signalLine
if macdfall and macdsell and (macdLine < signalLine) and ta.falling(low,2)
    shortCondition := true

if (shortCondition)
    strategy.entry("My Short Entry Id", strategy.short)