Indeks Kekuatan Relatif - Perbedaan - Libertus
Penulis:ChaoZhang, Tanggal: 2022-05-24 15:24:22Tag:RSI
Halo semua,
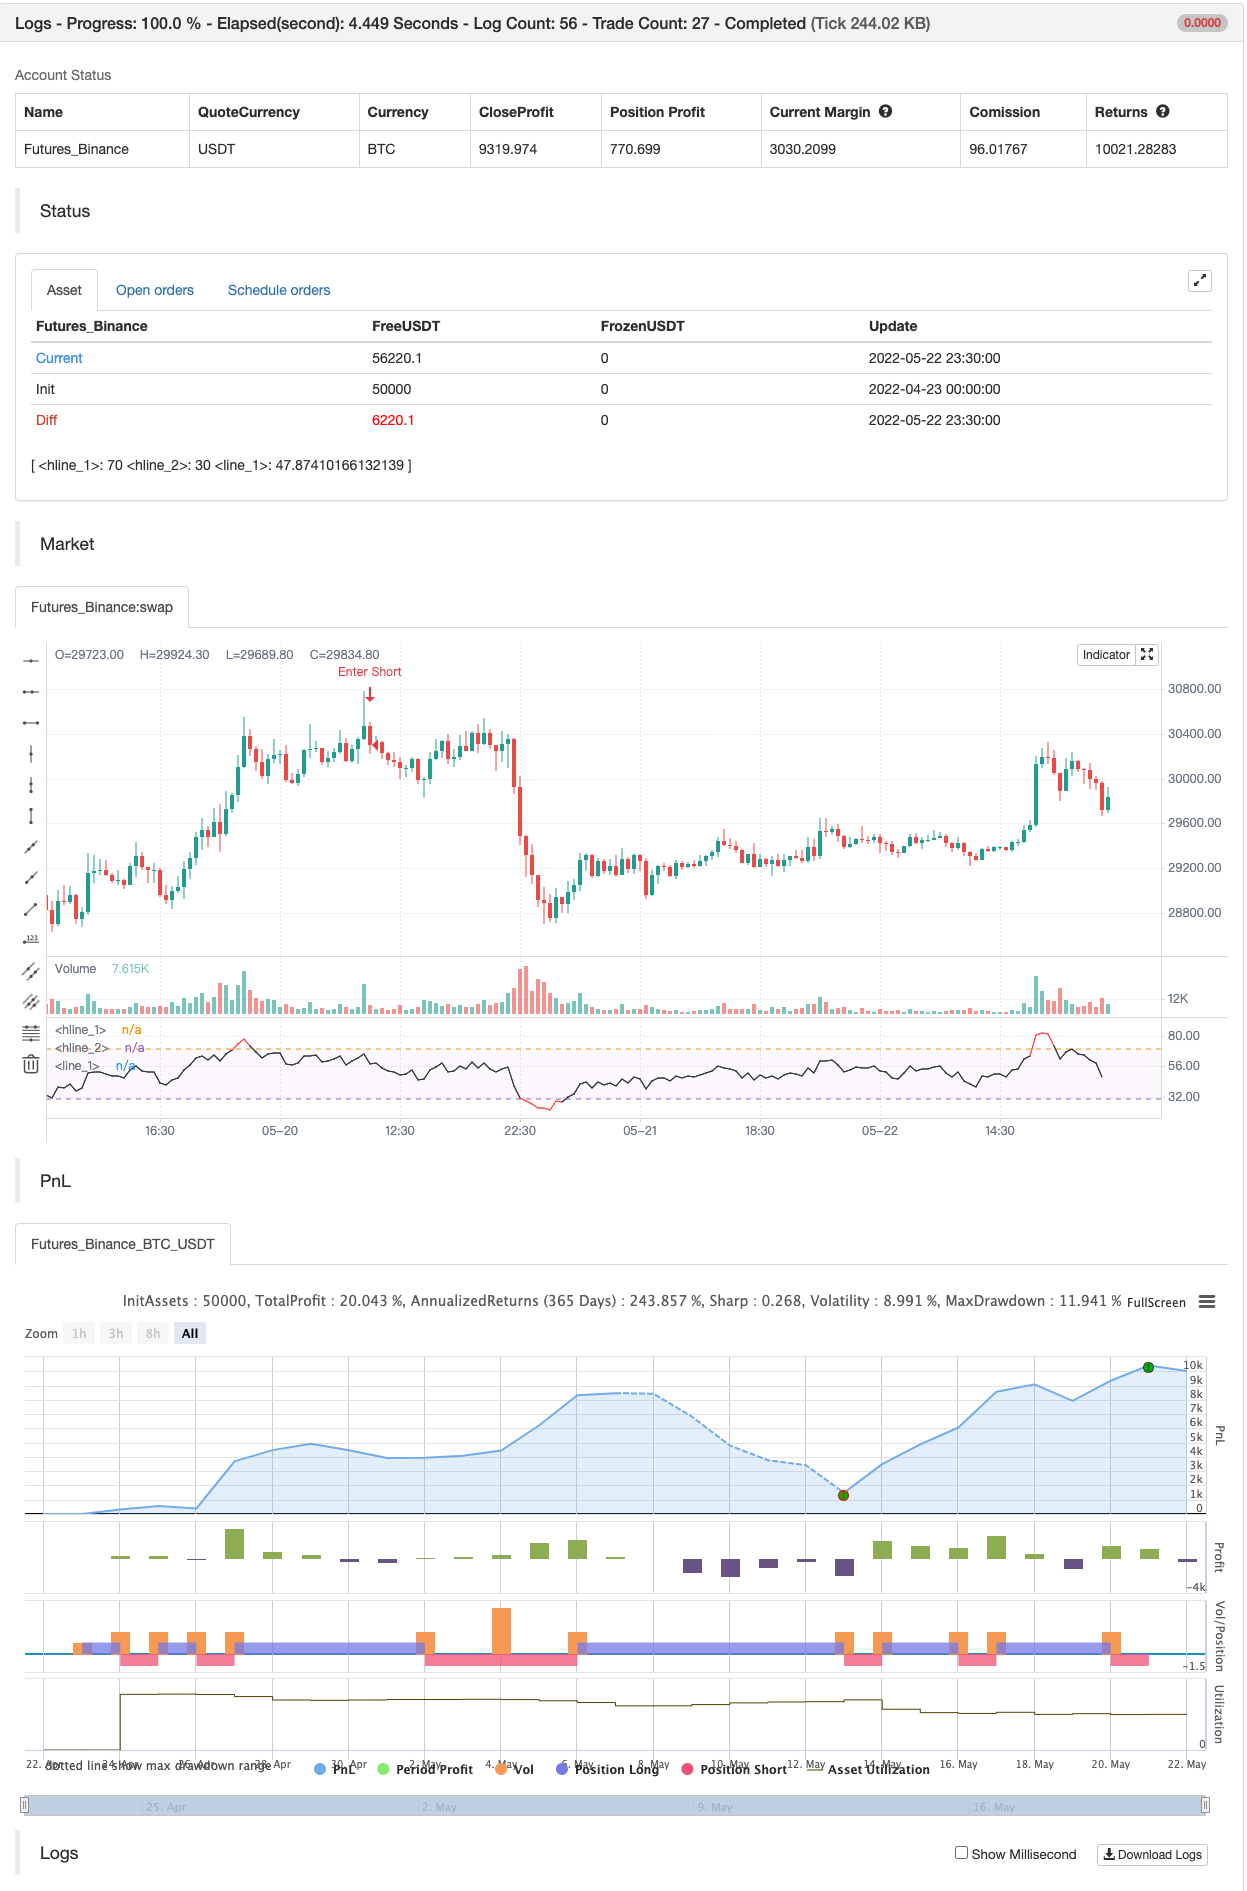
Untuk memudahkan pengalaman trading semua orang, saya membuat skrip ini yang mewarnai kondisi overbought dan oversold RSI dan sebagai bonus menampilkan divergensi bullish atau bearish dalam 50 lilin terakhir (secara default, Anda dapat mengubahnya). Script adalah open source, sebagian kode berasal dari contoh Trading View. Jika Anda memiliki saran atau Anda sudah membuat beberapa perbaikan, silakan laporkan di komentar.
Selamat berdagang dan semoga berhasil!
backtest

//@version=4
// Copyright by Libertus - 2021
// RSI Divergences v3.2
// Free for private use
study(title="Relative Strength Index - Divergences - Libertus", shorttitle="RSI Div - Lib")
len = input(14, minval=1, title="RSI Length")
ob = input(defval=70, title="Overbought", type=input.integer, minval=0, maxval=100)
os = input(defval=30, title="Oversold", type=input.integer, minval=0, maxval=100)

// RSI code
rsi = rsi(close, len)
band1 = hline(ob)
band0 = hline(os)
plot(rsi, color=(rsi > ob or rsi < os ? color.new(color.red, 0) : color.new(color.black, 0)))
fill(band1, band0, color=color.new(color.purple, 97))

// DIVS code
piv = input(false,"Hide pivots?")
shrt = input(false,"Shorter labels?")
hidel = input(false, "Hide labels and color background")
xbars = input(defval=90, title="Div lookback period (bars)?", type=input.integer, minval=1)
hb = abs(highestbars(rsi, xbars)) // Finds bar with highest value in last X bars
lb = abs(lowestbars(rsi, xbars)) // Finds bar with lowest value in last X bars

// Defining variable values, mandatory in Pine 3
max = float(na)
max_rsi = float(na)
min = float(na)
min_rsi = float(na)
pivoth = bool(na)
pivotl = bool(na)
divbear = bool(na)
divbull = bool(na)

// If bar with lowest / highest is current bar, use it's value
max := hb == 0 ? close : na(max[1]) ? close : max[1]
max_rsi := hb == 0 ? rsi : na(max_rsi[1]) ? rsi : max_rsi[1]
min := lb == 0 ? close : na(min[1]) ? close : min[1]
min_rsi := lb == 0 ? rsi : na(min_rsi[1]) ? rsi : min_rsi[1]

// Compare high of current bar being examined with previous bar's high
// If curr bar high is higher than the max bar high in the lookback window range
if close > max // we have a new high
    max := close // change variable "max" to use current bar's high value
if rsi > max_rsi // we have a new high
    max_rsi := rsi // change variable "max_rsi" to use current bar's RSI value
if close < min // we have a new low
    min := close // change variable "min" to use current bar's low value
if rsi < min_rsi // we have a new low
    min_rsi := rsi // change variable "min_rsi" to use current bar's RSI value

// Finds pivot point with at least 2 right candles with lower value
pivoth := (max_rsi == max_rsi[2]) and (max_rsi[2] != max_rsi[3]) ? true : na
pivotl := (min_rsi == min_rsi[2]) and (min_rsi[2] != min_rsi[3]) ? true : na

// Detects divergences between price and indicator with 1 candle delay so it filters out repeating divergences
if (max[1] > max[2]) and (rsi[1] < max_rsi) and (rsi <= rsi[1])
    divbear := true
if (min[1] < min[2]) and (rsi[1] > min_rsi) and (rsi >= rsi[1])
    divbull := true

// Alerts
alertcondition(divbear, title='Bear div', message='Bear div')
alertcondition(divbull, title='Bull div', message='Bull div')
alertcondition(pivoth, title='Pivot high', message='Pivot high')
alertcondition(pivotl, title='Pivot low', message='Pivot low')

if divbull
    strategy.entry("Enter Long", strategy.long)
else if divbear
    strategy.entry("Enter Short", strategy.short)

// // Plots divergences and pivots with offest
// l = divbear ?
//       label.new (bar_index-1, rsi[1]+1, "BEAR", color=color.red, textcolor=color.white, style=label.style_labeldown, yloc=yloc.price, size=size.small) :
//       divbull ?
//           label.new (bar_index-1, rsi[1]-1, "BULL", color=color.green, textcolor=color.white, style=label.style_labelup, yloc=yloc.price, size=size.small) :
//           pivoth ?
//               label.new (bar_index-2, max_rsi+1, "PIVOT", color=color.blue, textcolor=color.white, style=label.style_labeldown, yloc=yloc.price, size=size.small) :
//               pivotl ?
//                   label.new (bar_index-2, min_rsi-1, "PIVOT", color=color.blue, textcolor=color.white, style=label.style_labelup, yloc=yloc.price, size=size.small) :
//                   na

// // Shorter labels
// if shrt
//     label.set_text (l, na)
// // Hides pivots or labels
// if (piv and (pivoth or pivotl)) or hidel
//     label.delete (l)
// // Colors indicator background
// bgcolor (hidel ? (divbear ? color.new(color.red, 50) : divbull ? color.new(color.green, 50) : na) : na, offset=-1)
// bgcolor (hidel ? (piv ? na : (pivoth or pivotl ? color.new(color.blue, 50) : na)) : na, offset=-2)

// Debug tools
// plot(max, color=blue, linewidth=2)
// plot(max_rsi, color=red, linewidth=2)
// plot(hb, color=orange, linewidth=2)
// plot(lb, color=purple, linewidth=1)
// plot(min_rsi, color=lime, linewidth=1)
// plot(min, color=black, linewidth=1)
Artikel terkait
- Sistem strategi pengukuran tren momentum dua indikator
- Strategi perdagangan tren sinyal ganda rata-rata-RSI
- Strategi optimasi perdagangan intraday yang dikombinasikan dengan RSI
- Strategi pelacakan tren lintas indikator teknologi
- Strategi pelacakan tren bentuk pilar gajah
- Strategi momentum tren RSI dua siklus yang dikombinasikan dengan sistem manajemen posisi piramida
- Strategi perdagangan kuantitatif dengan RSI dinamis yang dibantu dengan cross-linear multi-uniform
- Tren Dinamis Menentukan Strategi RSI
- Algorithm K-Neighborhood Multidimensional dan Strategi Perdagangan Analisis Harga Kuantitatif
- Adaptive Multi-Strategy Dynamic Switching System: Strategi perdagangan kuantitatif untuk melacak tren konvergensi dan gesekan interval
- Tren multi-indikator multi-dimensi lintas strategi kuantifikasi tingkat lanjut
Informasi lebih lanjut
- Strategi Swing Hull/rsi/EMA
- Scalping Swing Trading Tool R1-4
- BEST Engulfing + Breakout Strategi
- Bollinger Awesome Alert R1
- Plugin Simultan Berbagai Bursa
- Triangle Leverage (menghasilkan mata uang kecil dengan harga pasar yang berbeda)
- bybit reverse contract dynamic grid (jaring khusus)
- TradingView Alerts untuk MT4 MT5 + variabel dinamis
- Seri Matriks
- Super Scalper - 5 menit 15 menit
- Regresi linier ++
- RedK Dual VADER dengan Energy Bar
- Zona Konsolidasi - Hidup
- Perkiraan Kuantitatif Kualitatif
- Peringatan lintas rata-rata bergerak, multi-frame time (MTF)
- MACD Reloaded STRATEGY
- Rata-rata Bergerak SuperTrended
- Perdagangan ABC
- 15MIN BTCUSDTPERP BOT
- Entropi Shannon V2