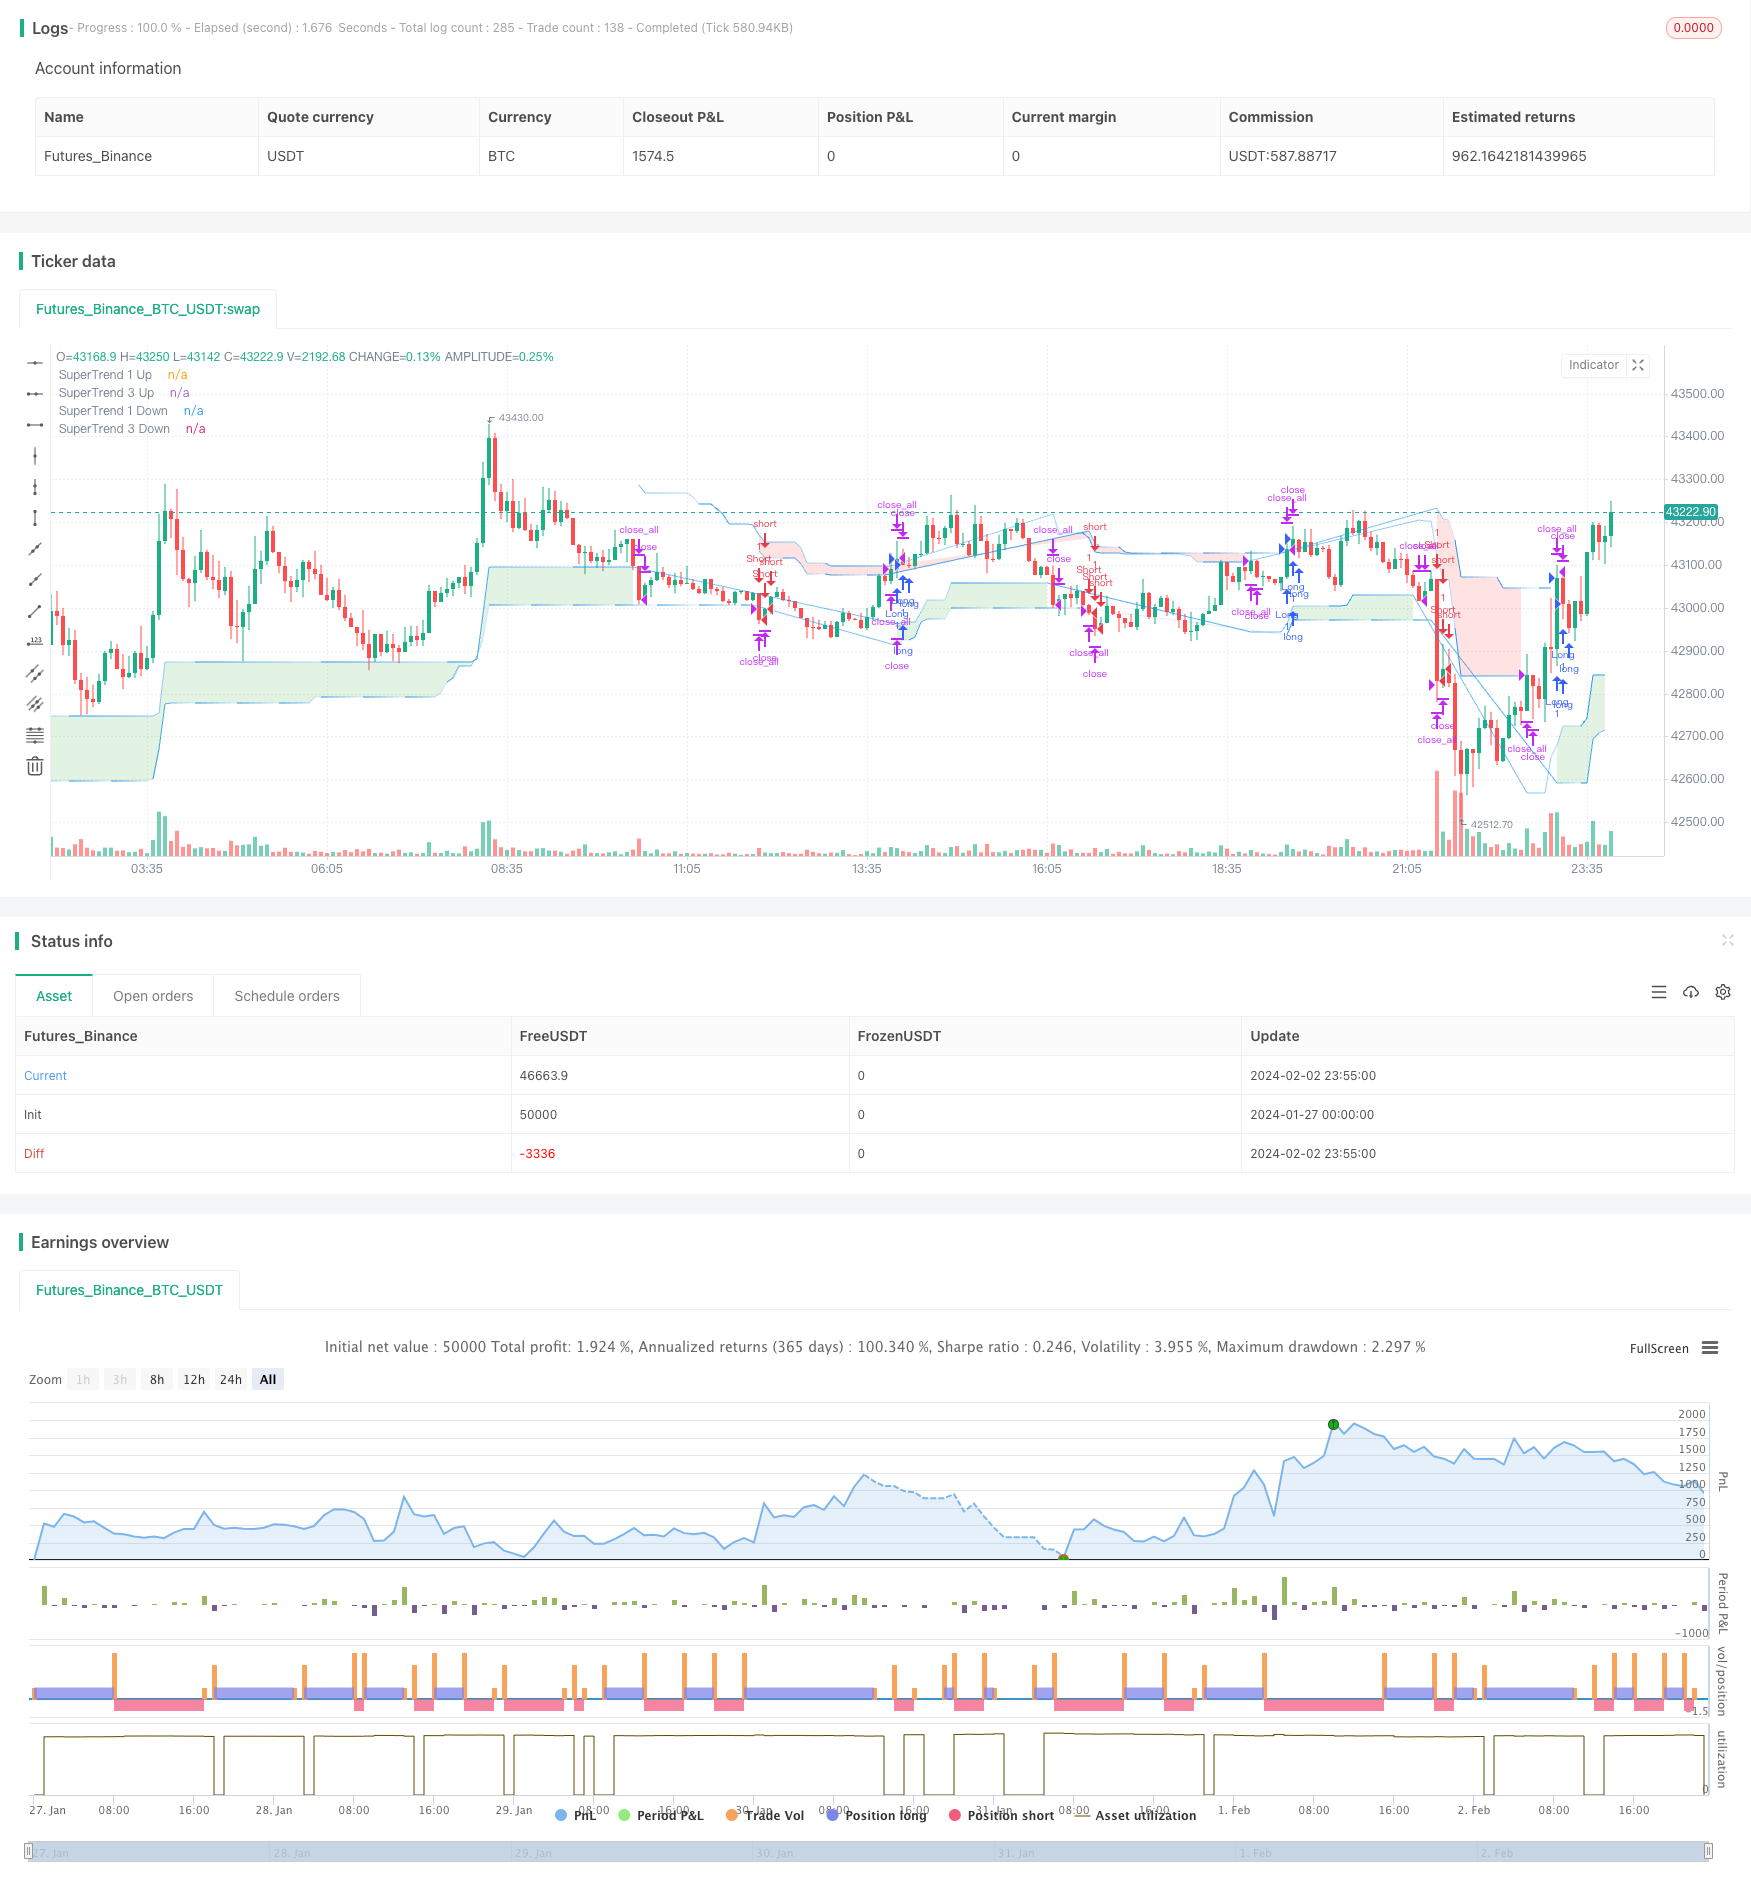
Strategi Waktu Indikator Ganda Momentum Kuadrat
Penulis:ChaoZhangTanggal: 2024-02-04 15:53:48Tag:

Gambaran umum
Strategi ini menggabungkan indikator SuperTrend dengan teori Elliott Wave untuk membangun alat perdagangan teknis yang kuat.
Prinsip Strategi
Ide utamanya terletak pada pendekatan bertingkatnya:
- Menggunakan 4 indikator SuperTrend, masing-masing dengan panjang ATR yang berbeda dan pengganda untuk menilai tren dari jangka pendek ke jangka panjang
- Tentukan sinyal panjang dan pendek yang kuat melalui konvergensi indikator
- Lihat metode pengenalan pola Elliott Wave
untuk mengidentifikasi perilaku pasar yang serupa untuk mengkonfirmasi sinyal perdagangan
Dengan demikian, ia memanfaatkan beberapa indikator dan menambahkan pengenalan pola untuk membuat strategi lebih kuat.
Analisis Keuntungan
- Desain multi-indikator memberikan penilaian yang komprehensif
- Inspirasi teori gelombang meningkatkan stabilitas melalui pengenalan pola
- Penyesuaian arah real-time beradaptasi dengan perubahan pasar
- Parameter yang dapat dikonfigurasi sesuai dengan produk dan kerangka waktu yang berbeda
Analisis Risiko
- Pengaturan parameter bergantung pada pengalaman, yang membutuhkan penyesuaian untuk menentukan kombinasi parameter yang optimal
- Desain multi-indikator rumit, meningkatkan beban komputasi
- Tidak bisa sepenuhnya menghindari generasi sinyal yang salah
Parameter dapat dioptimalkan untuk secara bertahap menentukan yang optimal; komputasi awan dapat meningkatkan kinerja komputasi; stop loss dapat mengendalikan risiko.
Arahan Optimasi
Optimalisasi dapat dilakukan dalam beberapa aspek:
- Tambahkan modul penyesuaian parameter adaptif untuk menyesuaikan parameter secara dinamis berdasarkan kondisi pasar
- Mengintegrasikan model pembelajaran mesin untuk membantu menilai keandalan sinyal
- Menggabungkan indikator sentimen, peristiwa berita dll untuk menentukan rezim pasar
- Mendukung template parameter multi-produk untuk mengurangi beban kerja pengujian
Hal ini akan membuat parameter strategi lebih cerdas, penilaian lebih akurat, dan penerapan praktis lebih nyaman.
Ringkasan
Strategi ini secara komprehensif mempertimbangkan kedua dimensi tren dan pola, memastikan kekuatan penilaian sambil meningkatkan fleksibilitas. Multi-indikator dan pengaturan parameter memastikan penerapan pasar penuh. Dengan penggabungan lebih lanjut dari metode cerdas dan otomatis, kepraktisan strategi dapat sangat ditingkatkan. Ini memberikan inspirasi berharga dan referensi untuk kemajuan perdagangan teknis.
/*backtest
start: 2024-01-27 00:00:00
end: 2024-02-03 00:00:00
period: 5m
basePeriod: 1m
exchanges: [{"eid":"Futures_Binance","currency":"BTC_USDT"}]
*/

//@version=5
strategy("Elliott's Quadratic Momentum - Strategy [presentTrading]",shorttitle = "EQM Strategy [presentTrading]", overlay=true )

// Inputs for selecting trading direction
tradingDirection = input.string("Both", "Select Trading Direction", options=["Long", "Short", "Both"])


// SuperTrend Function
supertrend(src, atrLength, multiplier) =>
    atr = ta.atr(atrLength)
    up = hl2 - (multiplier * atr)
    dn = hl2 + (multiplier * atr)
    trend = 1
    trend := nz(trend[1], 1)
    up := src > nz(up[1], 0) and src[1] > nz(up[1], 0) ?   math.max(up, nz(up[1], 0)) : up
    dn := src < nz(dn[1], 0) and src[1] < nz(dn[1], 0) ? math.min(dn, nz(dn[1], 0)) : dn
    trend := src > nz(dn[1], 0) ?  1 : src < nz(up[1], 0)? -1 : nz(trend[1], 1)
    [up, dn, trend]

// Inputs for SuperTrend settings
atrLength1 = input(7, title="ATR Length for SuperTrend 1")
multiplier1 = input(4.0, title="Multiplier for SuperTrend 1")
atrLength2 = input(14, title="ATR Length for SuperTrend 2")
multiplier2 = input(3.618, title="Multiplier for SuperTrend 2")
atrLength3 = input(21, title="ATR Length for SuperTrend 3")
multiplier3 = input(3.5, title="Multiplier for SuperTrend 3")
atrLength4 = input(28, title="ATR Length for SuperTrend 3")
multiplier4 = input(3.382, title="Multiplier for SuperTrend 3")

// Calculate SuperTrend
[up1, dn1, trend1] = supertrend(close, atrLength1, multiplier1)
[up2, dn2, trend2] = supertrend(close, atrLength2, multiplier2)
[up3, dn3, trend3] = supertrend(close, atrLength3, multiplier3)
[up4, dn4, trend4] = supertrend(close, atrLength4, multiplier4)


// Entry Conditions based on SuperTrend and Elliott Wave-like patterns
longCondition = trend1 == 1 and trend2 == 1 and trend3 == 1 and trend4 == 1
shortCondition = trend1 == -1 and trend2 == -1 and trend3 == -1 and trend4 == - 1

// Strategy Entry logic based on selected trading direction
if tradingDirection == "Long" or tradingDirection == "Both"
    if longCondition
        strategy.entry("Long", strategy.long)
        // [Any additional logic for long entry]

if tradingDirection == "Short" or tradingDirection == "Both"
    if shortCondition
        strategy.entry("Short", strategy.short)
        // [Any additional logic for short entry]


// Exit conditions - Define your own exit strategy
// Example: Exit when any SuperTrend flips
if trend1 != trend1[1] or trend2 != trend2[1] or trend3 != trend3[1] or trend4 != trend4[1]
    strategy.close_all()

// Function to apply gradient effect
gradientColor(baseColor, length, currentBar) =>
    var color res = color.new(baseColor, 100)
    if currentBar <= length
        res := color.new(baseColor, int(100 * currentBar / length))
    res

// Apply gradient effect
color1 = gradientColor(color.blue, atrLength1, bar_index % atrLength1)
color4 = gradientColor(color.blue, atrLength4, bar_index % atrLength3)


// Plot SuperTrend with gradient for upward trend
plot1Up = plot(trend1 == 1 ? up1 : na, color=color1, linewidth=1, title="SuperTrend 1 Up")
plot4Up = plot(trend4 == 1 ? up4 : na, color=color4, linewidth=1, title="SuperTrend 3 Up")

// Plot SuperTrend with gradient for downward trend
plot1Down = plot(trend1 == -1 ? dn1 : na, color=color1, linewidth=1, title="SuperTrend 1 Down")
plot4Down = plot(trend4 == -1 ? dn4 : na, color=color4, linewidth=1, title="SuperTrend 3 Down")

// Filling the area between the first and third SuperTrend lines for upward trend
fill(plot1Up, plot4Up, color=color.new(color.green, 80), title="SuperTrend Upward Band")

// Filling the area between the first and third SuperTrend lines for downward trend
fill(plot1Down, plot4Down, color=color.new(color.red, 80), title="SuperTrend Downward Band")
- Willy Wonka Breakout Strategi
- Trend Kombinasi Rata-rata Gerak Eksponensial dan Indeks Kekuatan Relatif Mengikuti Strategi
- Strategi Kombo Stop Loss Dinamis
- Golden Parabola Breakout Strategi
- Strategi Pelacakan Pembalikan Momentum SAR
- Strategi Perdagangan RSI Dinamis
- Strategi Crossover antara beberapa moving average
- Strategi Penembusan Rata-rata Bergerak Ganda
- Strategi Crossover Rata-rata Bergerak
- Strategi Pelacakan Tren Rata-rata Bergerak Ganda
- Renko dan Relative Vigor Index Trend Mengikuti Strategi
- Swing Trend Moving Average Strategi
- Bollinger Band, Moving Average dan Strategi Trading Kombinasi MACD
- Strategi Mata Uang Crypto Momentum Price Climbing
- Strategi Momentum Trading Berdasarkan Model Multi-Faktor
- Adaptive Bollinger Bands Trend Tracking Strategi
- Strategi RSI Breakout yang ditingkatkan dengan Stop Loss dan Take Profit
- Strategi perdagangan kuantitatif berdasarkan RSI dan Bollinger Bands
- Strategi Perdagangan Kuantitatif Berdasarkan SMA dan Rolling Trendline
- Strategi perdagangan opsi mingguan stokastis