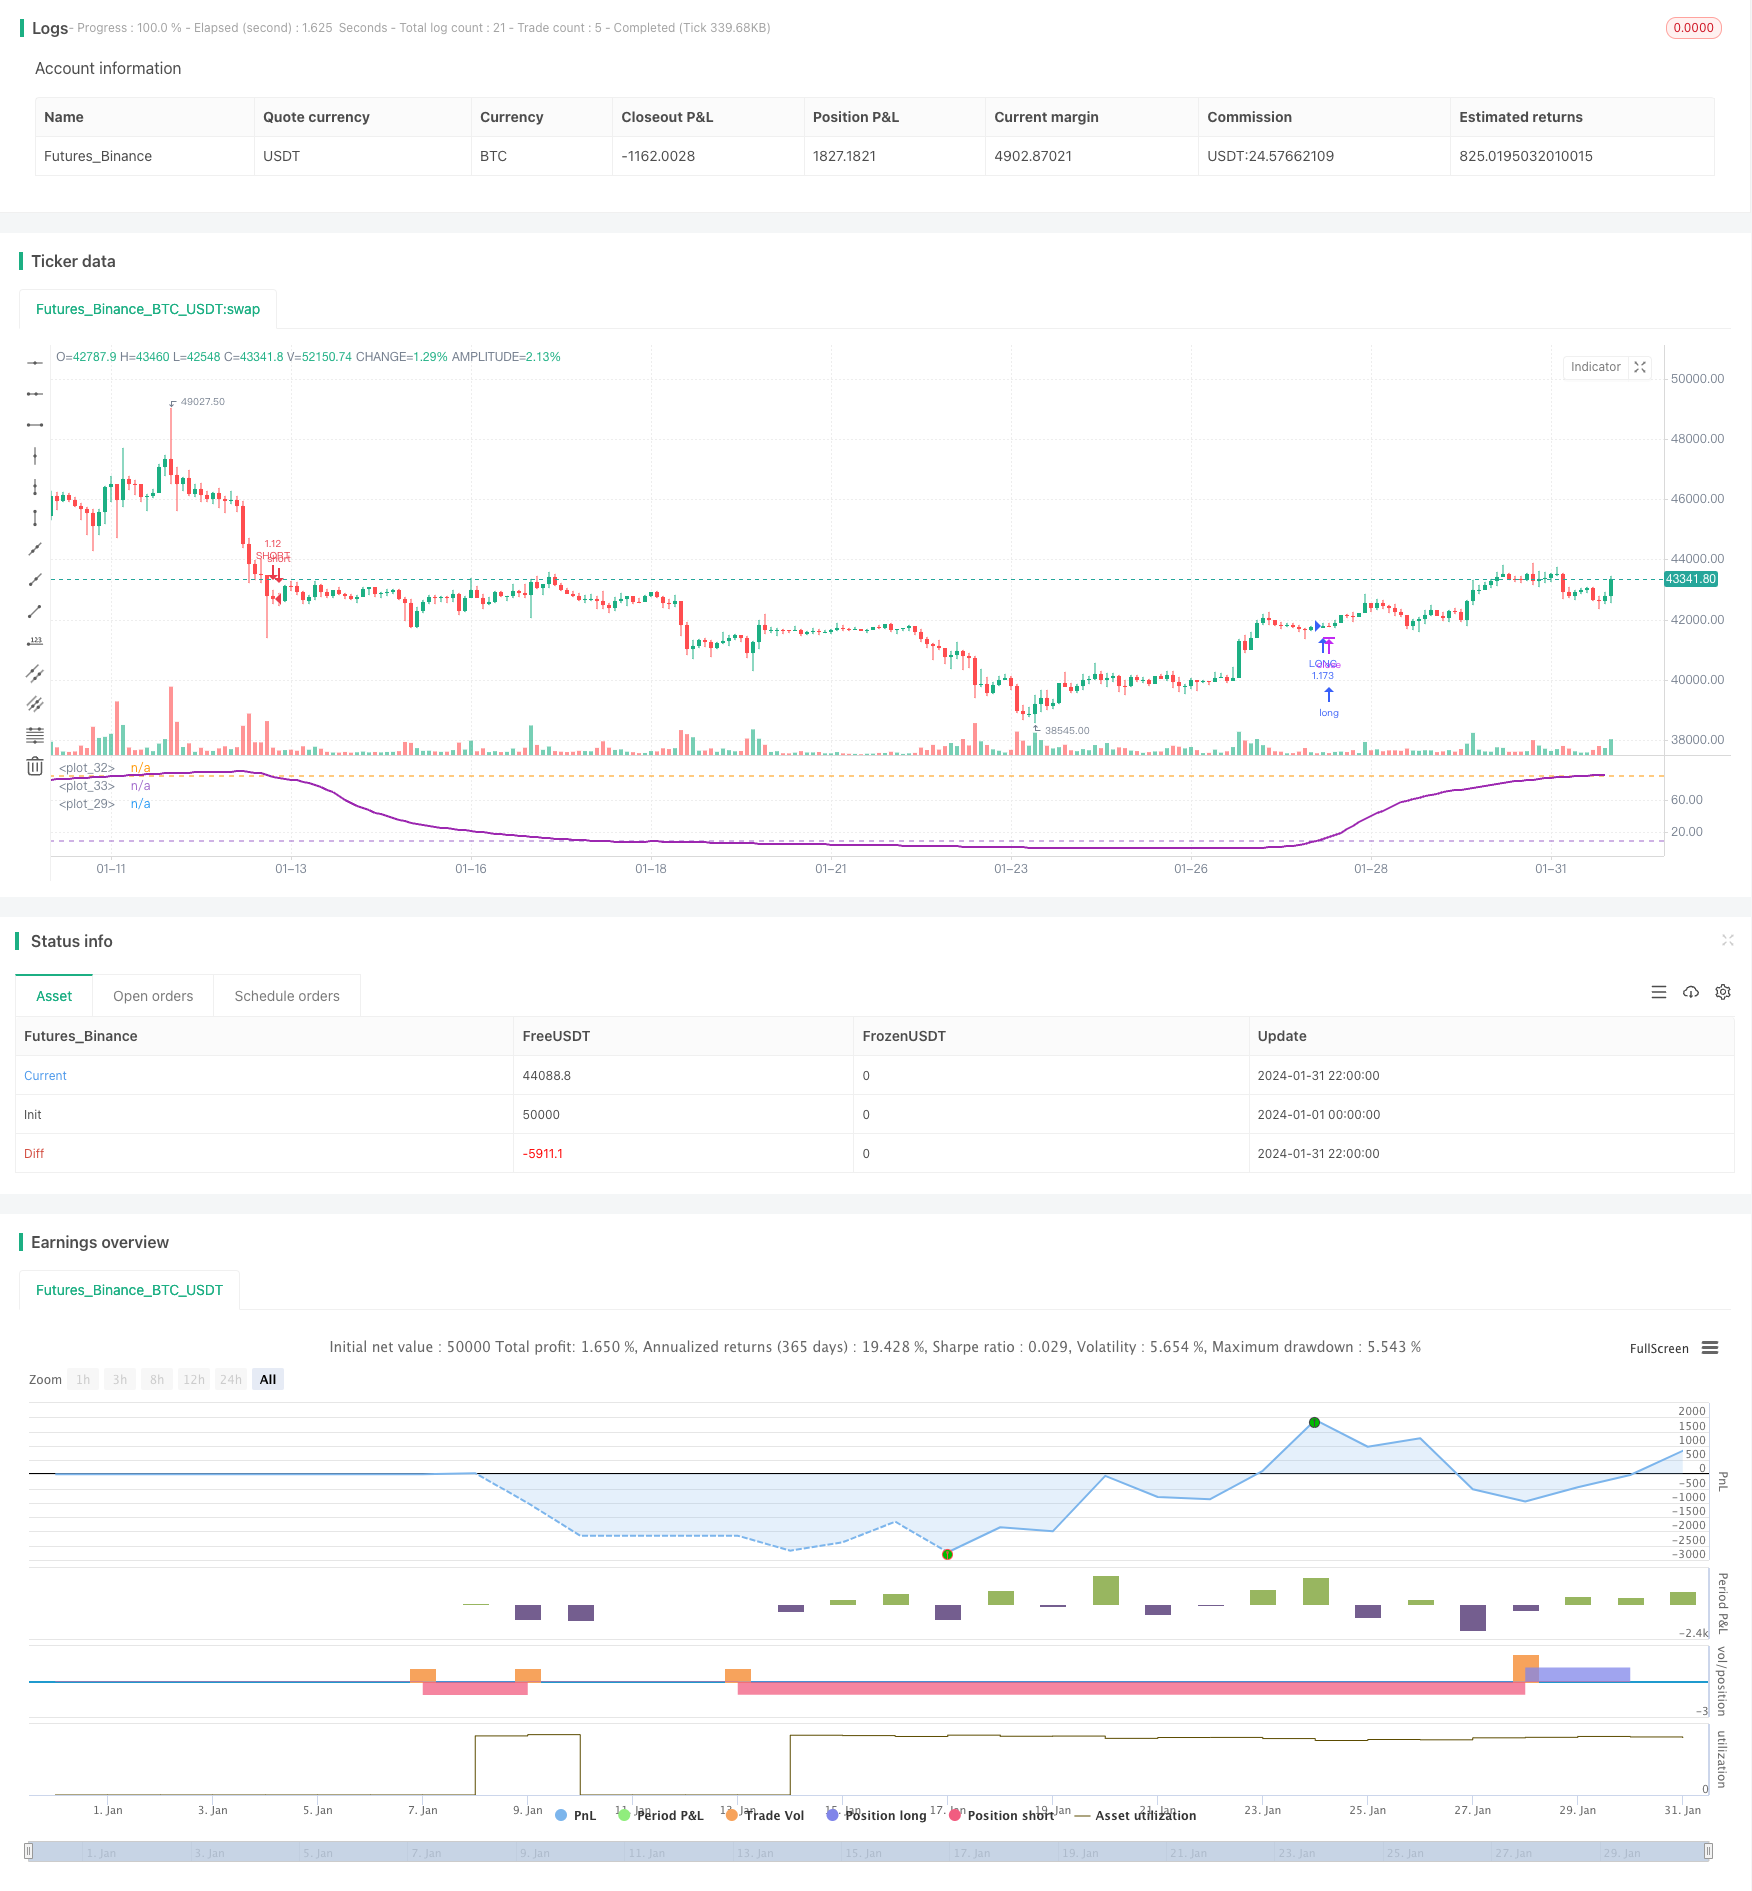
Strategi perdagangan ayunan RSI berdasarkan penyesuaian intra-tahun
Tanggal Pembuatan:
2024-02-29 10:54:45
Akhirnya memodifikasi:
2024-02-29 10:54:45
menyalin:
0
Jumlah klik:
608
1
fokus pada
1627
Pengikut

Ringkasan
Strategi ini adalah strategi perdagangan RSI bergoyang berdasarkan penyesuaian tahunan, dengan melacak karakteristik bergoyang antara indikator RSI di atas dan di bawah rel yang ditetapkan, dan mengirimkan sinyal perdagangan ketika indikator RSI menyentuh rel di atas dan di bawah.
Prinsip Strategi
- Setting MA Average Line Length, RSI Parameter, Up and Down Trajectory, Stop Loss Parameter, dan Range Periode Perdagangan
- Untuk menghitung RSI, RSI = (rata-rata kenaikan) / (rata-rata kenaikan + penurunan)*100
- Menggambar indikator RSI dan naik turun
- Indikator RSI di atas melompat ke bawah sebagai sinyal multi, di bawah melompat ke atas sebagai sinyal kosong
- Pembukaan Posisi dan Pembentukan Daftar Deposit OCO
- Hentikan dan hentikan stop loss sesuai dengan logika stop loss yang disetel
Analisis Keunggulan Strategi
- Dengan mengatur siklus transaksi dalam setahun, beberapa lingkungan eksternal yang tidak sesuai dapat dihindari.
- Indikator RSI dapat secara efektif mencerminkan kondisi overbought dan oversold, dan dapat memfilter sebagian dari kebisingan dengan mengatur interval yang wajar untuk perdagangan bergoyang.
- Pengaturan Stop Loss dan OCO dapat digunakan untuk pengendalian risiko yang efisien.
Analisis Risiko Strategi
- RSI tidak dapat menjamin keakuratan penilaian kritis, dan mungkin ada risiko kesalahan penilaian tertentu.
- Siklus perdagangan yang tidak tepat dalam satu tahun dapat menyebabkan kehilangan peluang perdagangan yang lebih baik atau memasuki lingkungan perdagangan yang tidak sesuai.
- Stop loss yang terlalu besar dapat menyebabkan kerugian yang lebih besar, dan stop loss yang terlalu kecil dapat menyebabkan keuntungan yang terlalu kecil.
Hal ini dapat dioptimalkan dengan menyesuaikan parameter RSI, jangka waktu siklus perdagangan, stop loss ratio, dan lain-lain.
Arah optimasi strategi
- Uji optimum dari parameter RSI pada periode yang berbeda di pasar yang berbeda
- Analisis siklus pasar secara keseluruhan untuk menentukan periode perdagangan terbaik dalam setahun
- Determinasi rasio stop loss yang wajar melalui retrospeksi
- Optimalkan pilihan varietas perdagangan dan meningkatkan skala kepemilikan
- Optimalisasi dengan teknik atau indikator lain yang lebih baik
Meringkaskan
Strategi ini melakukan perdagangan pelacakan tren melalui indikator RSI pada periode yang ditentukan dalam satu tahun, secara efektif mengendalikan risiko perdagangan. Efisiensi strategi yang lebih tinggi dapat diperoleh melalui pengoptimalan parameter dan pengoptimalan aturan.
Kode Sumber Strategi
/*backtest
start: 2024-01-01 00:00:00
end: 2024-01-31 23:59:59
period: 2h
basePeriod: 15m
exchanges: [{"eid":"Futures_Binance","currency":"BTC_USDT"}]
*/

//@version=3
strategy(title = "Bitlinc MARSI Study AST",shorttitle="Bitlinc MARSI Study AST",default_qty_type = strategy.percent_of_equity, default_qty_value = 100,commission_type=strategy.commission.percent,commission_value=0.1,initial_capital=1000,currency="USD",pyramiding=0, calc_on_order_fills=false)

// === General Inputs ===
lengthofma = input(62, minval=1, title="Length of MA")
len = input(31, minval=1, title="Length")
upperband = input(89, minval=1, title='Upper Band for RSI')
lowerband = input(10, minval=1, title="Lower Band for RSI")
takeprofit =input(1.25, title="Take Profit Percent")
stoploss =input(.04, title ="Stop Loss Percent")
monthfrom =input(8, title = "Month Start")
monthuntil =input(12, title = "Month End")
dayfrom=input(1, title= "Day Start")
dayuntil=input(31, title= "Day End")

// === Innput Backtest Range ===
//FromMonth = input(defval = 9, title = "From Month", minval = 1, maxval = 12)
//FromDay   = input(defval = 1, title = "From Day", minval = 1, maxval = 31)
//FromYear  = input(defval = 2018, title = "From Year", minval = 2017)
//ToMonth   = input(defval = 1, title = "To Month", minval = 1, maxval = 12)
//ToDay     = input(defval = 1, title = "To Day", minval = 1, maxval = 31)
//ToYear    = input(defval = 9999, title = "To Year", minval = 2017)

// === Create RSI ===
src=sma(close,lengthofma)
up = rma(max(change(src), 0), len)
down = rma(-min(change(src), 0), len)
rsi = down == 0 ? 100 : up == 0 ? 0 : 100 - (100 / (1 + up / down))
plot(rsi,linewidth = 2, color=purple)

// === Plot Bands ===
band1 = hline(upperband)
band0 = hline(lowerband)
fill(band1, band0, color=blue, transp=95)

// === Entry and Exit Methods ===
longCond =  crossover(rsi,lowerband)
shortCond =  crossunder(rsi,upperband)

// === Long Entry Logic ===
if (  longCond )
    strategy.entry("LONG", strategy.long, stop=close, oca_name="TREND", comment="LONG")
else
    strategy.cancel(id="LONG")

// === Short Entry Logic ===
if ( shortCond   )
    strategy.entry("SHORT", strategy.short,stop=close, oca_name="TREND",  comment="SHORT")
else
    strategy.cancel(id="SHORT")

// === Take Profit and Stop Loss Logic ===
//strategy.exit("Take Profit LONG", "LONG", profit = close * takeprofit / syminfo.mintick, loss = close * stoploss / syminfo.mintick)
//strategy.exit("Take Profit SHORT", "SHORT", profit = close * takeprofit / syminfo.mintick, loss = close * stoploss / syminfo.mintick)
strategy.exit("LONG TAKE PROFIT", "LONG", profit = close * takeprofit / syminfo.mintick)
strategy.exit("SHORT STOP LOSS", "SHORT", profit = close * takeprofit / syminfo.mintick)
strategy.exit("LONG STOP LOSS", "LONG", loss = close * stoploss / syminfo.mintick)
strategy.exit("SHORT STOP LOSS", "SHORT", loss = close * stoploss / syminfo.mintick)