ストラットを購入/売却
作者: リン・ハーンチャオチャン, 日時: 2022-05-09 11:10:10タグ:エイマ
この戦略は,次の基準を満たすときに,購入または販売信号を生成します.
9 EMAが21 EMAを横切る 最近閉鎖されたキャンドルスタイクは,前5個のキャンドルよりも平均的な容量が15%高い ろうそくの逆転パターン 価格が9 EMA を横切る
好きなように使って 変更してもいいよ
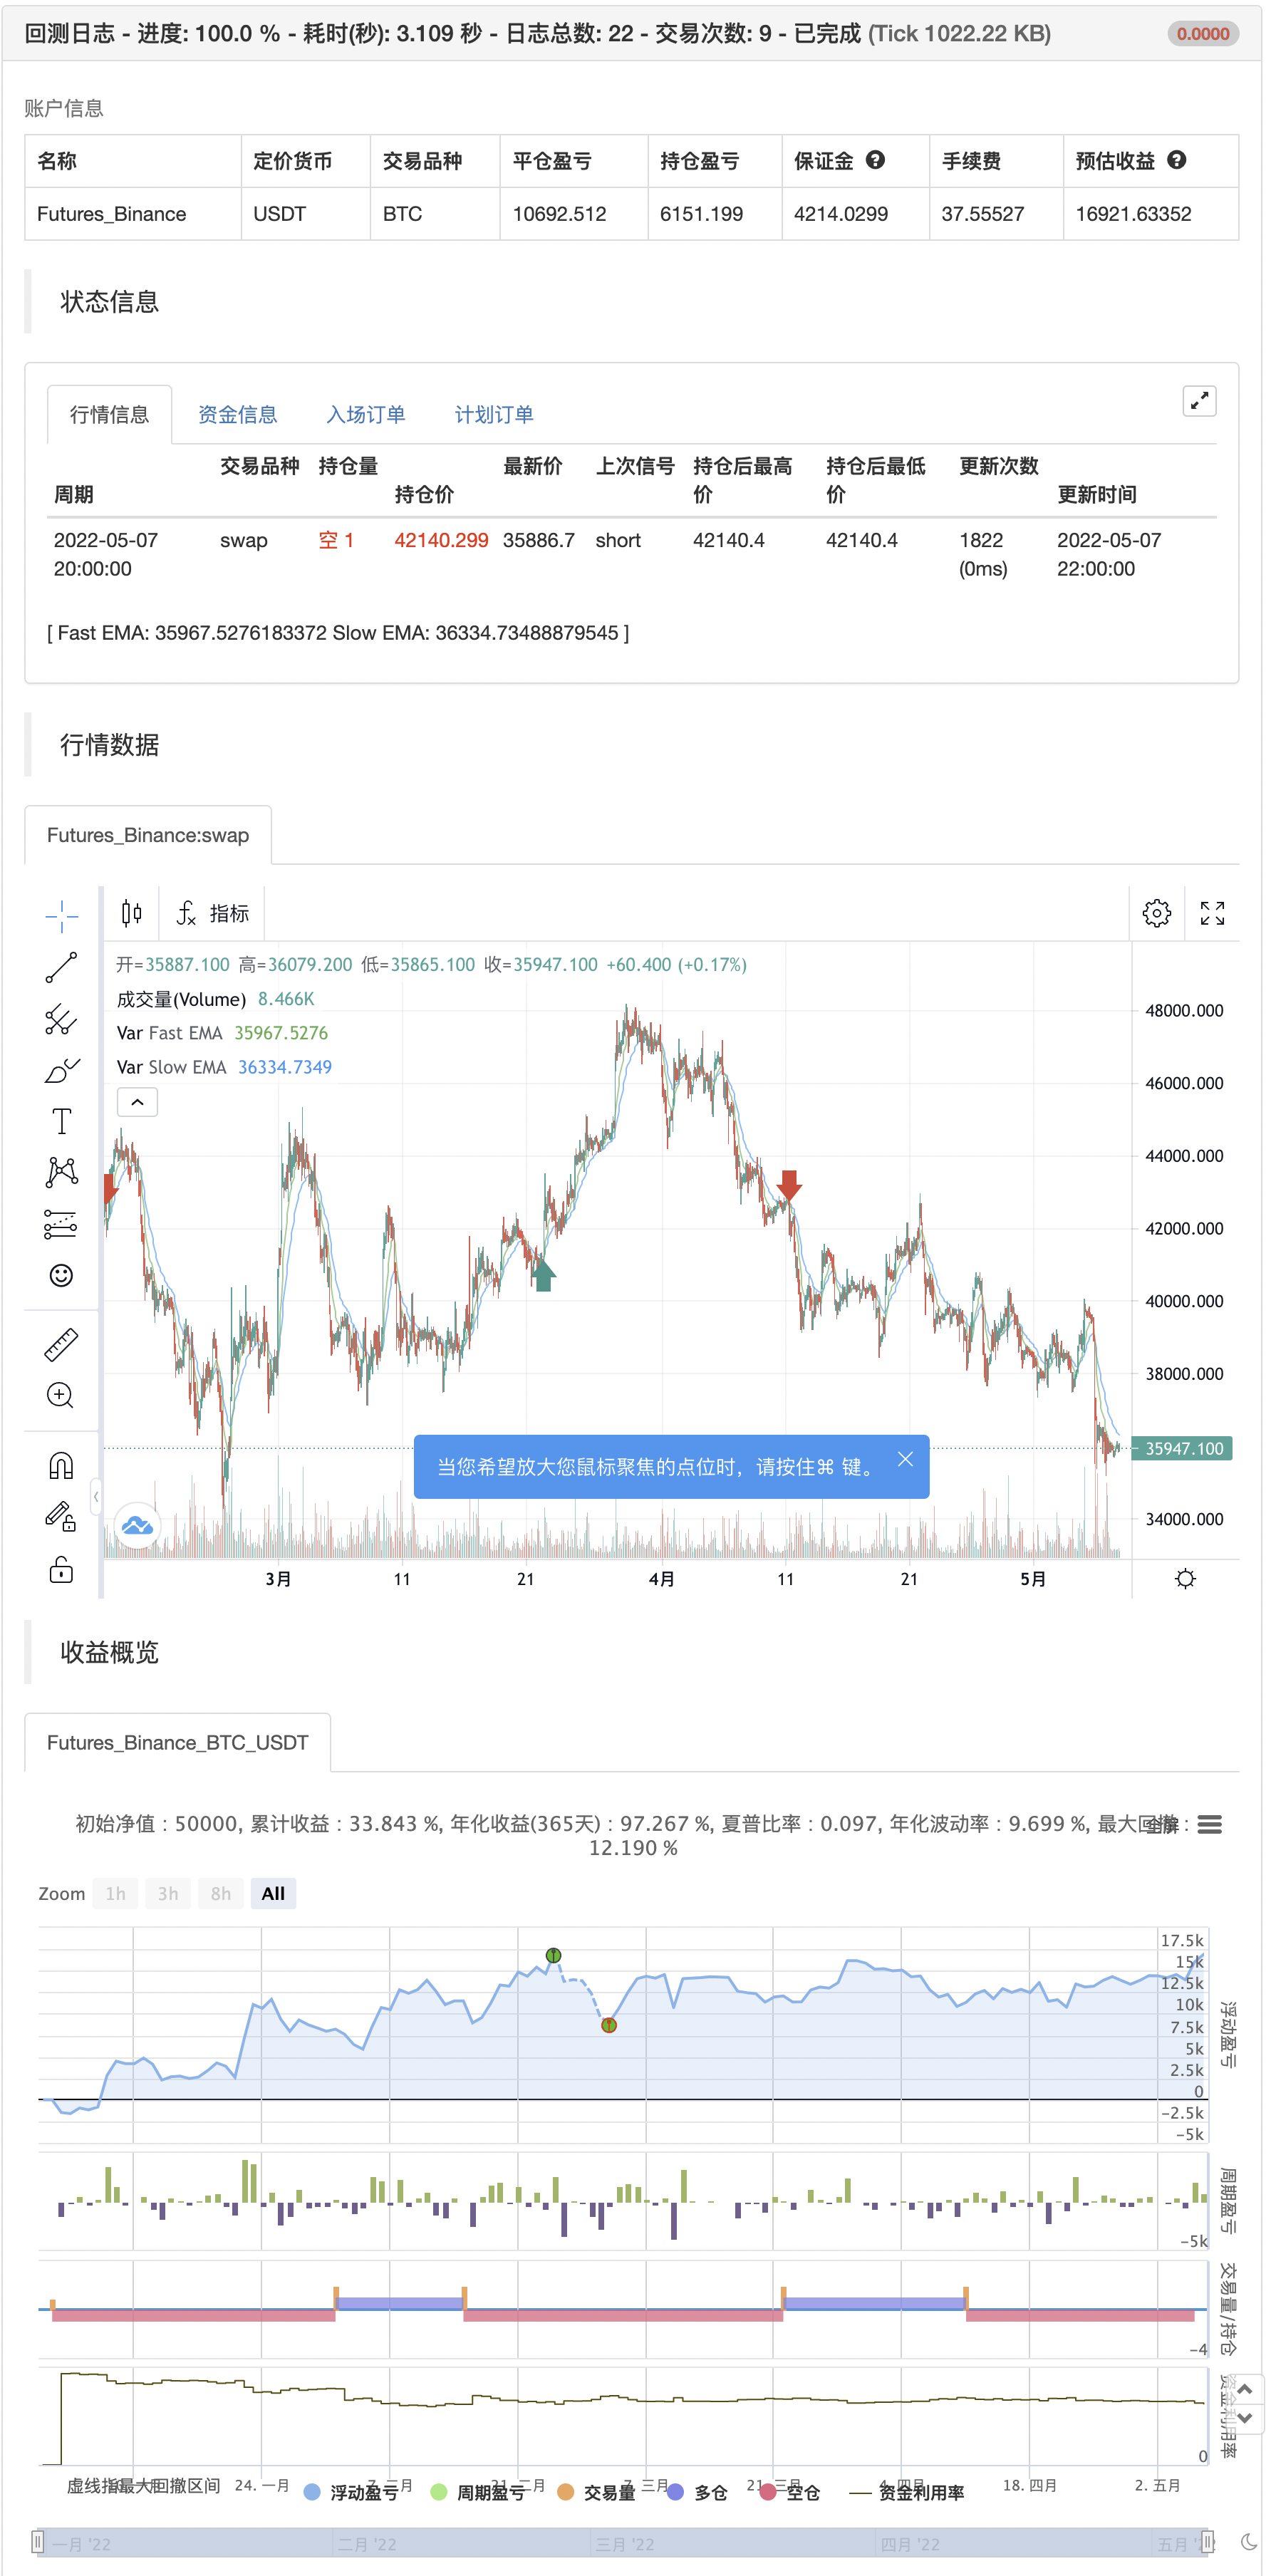
バックテスト

/*backtest
start: 2022-01-01 00:00:00
end: 2022-05-07 23:59:00
period: 2h
basePeriod: 15m
exchanges: [{"eid":"Futures_Binance","currency":"BTC_USDT"}]
*/

//@version=5
//Author: Andrew Shubitowski
strategy("Buy/Sell Strat", overlay = true)

//Define EMAs & Crossovers (Feature 2)
a = ta.ema(close, 9)
b = ta.ema(close, 21)
crossUp = ta.crossover(a, b)
crossDown = ta.crossunder(a, b)


//Define & calc volume averages (Feature 1)
float volAvg = 0
for i = 1 to 5
    volAvg := volAvg + volume[i]
volAvg := volAvg / 5

//Define candlestick pattern recongition (Feature 4)
bool reversalPatternUp = false
bool reversalPatternDown = false
if (close > close[1] and close[1] > close [2] and close[3] > close[2] and close > close[3])
    reversalPatternUp := true

if (close < close[1] and close[1] < close [2] and close[3] < close[2] and close < close[3])
    reversalPatternDown := true

//Execute trade (Feature 3 + 5)
if (crossUp)
    strategy.entry("long", strategy.long, when = ((volume * 0.85) > volAvg and close > a and reversalPatternUp == true))

if (crossDown)
    strategy.entry("short", strategy.short, when = ((volume * 0.85) > volAvg and close < a and reversalPatternDown == true))

//Exit strategy (New Feature)
//close_condition_long = close < a
//close_condition_short = close > a
//if (close_condition_long)
//    strategy.close("long")
//
//if (close_condition_short)
//    strategy.close("short")

//plot the EMAs
plot(a, title = "Fast EMA", color = color.green)
plot(b, title = "Slow EMA", color = color.blue)


//Some visual validation parameters
//plotchar(volAvg, "Volume", "", location.top, color.aqua) //*TEST* volume calc check
//plotshape(reversalPatternUp, style = shape.arrowup, color = color.aqua) //*TEST* reversal check
//plotshape(reversalPatternDown, style = shape.arrowup, location = location.belowbar, color = color.red) //*TEST* reversal check
関連コンテンツ
- 多次元トレンド判断とATR動的ストップ・ロスト戦略
- 高級マルチインデクタルのトレンド 取引戦略の確認
- 適応傾向追跡と多重確認取引戦略
- ダイナミック・均線システムとRSI動向指標を組み合わせた日内取引最適化戦略
- 複数の技術指標をクロスする動力傾向追跡戦略
- EMAのトレンドと回転が取引戦略を突破する
- 多均線交差補助RSI動的パラメータ量化取引戦略
- RSIの交差戦略を決定する動向
- ダブルクロストレンド追跡戦略:指数均線とMACD協同取引システム
- 多指標多次元的なトレンドを交差する高度量化戦略
- マルチスライド均線ダイナミッククロストレンド追跡とマルチ確認量化取引戦略
もっと見る
- CCI + EMAとRSIクロス戦略
- EMA バンド + leledc + ボリンガー バンド トレンドキャッチ戦略
- RSI MTF Ob+Os
- MACD ウィリー戦略
- RSI - 買って売るシグナル
- ハイキン・アシ 傾向
- HA 市場バイアス
- イチモク雲スムーズオシレーター
- ウィリアムズ %R - 滑らか
- QQEMOD + SSLハイブリッド + ワダアター爆発
- トリプルスーパートレンドとEMAとADX
- トム・デマルク 連続熱地図
- jma + dwma 多穀物による
- マジックMACD
- 信号によるZスコア
神 易波動率戦略 パイン語版 - 3EMA + ボーリンガー + PIVOT
- 多粒のバゲット
- ミルマシーン
- Kの逆転指標 I