双重RSI平均逆転戦略
作者: リン・ハーンチャオチャン,日付: 2023-10-23 15:46:33タグ:

概要
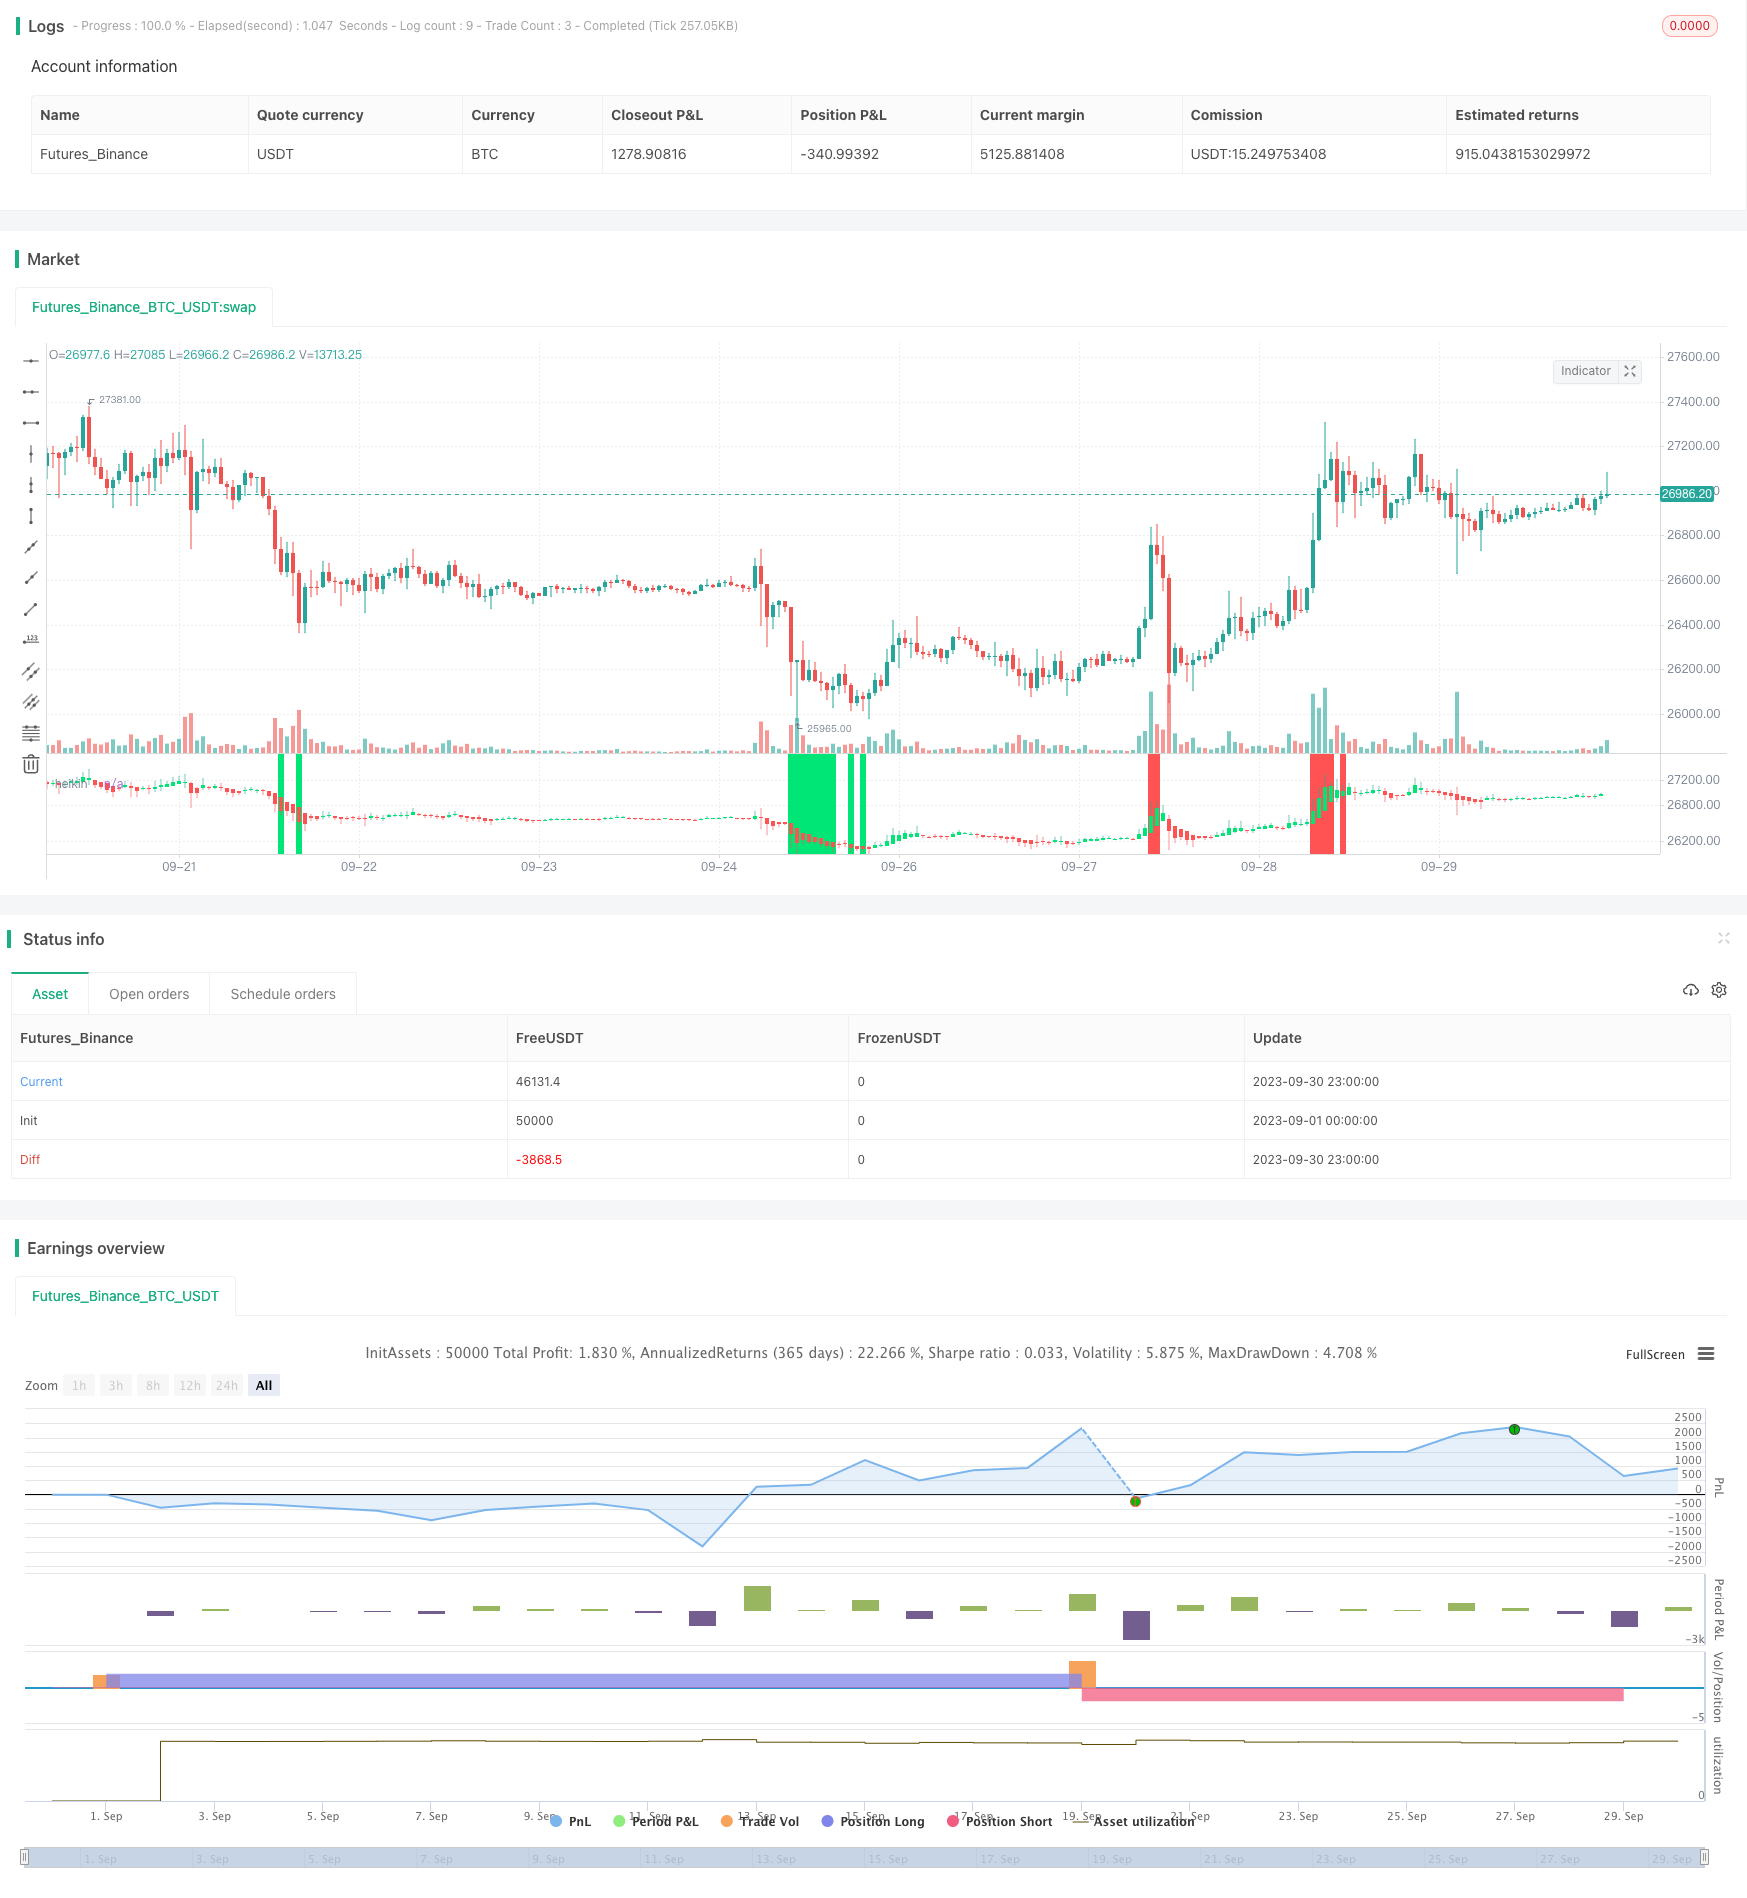
ダブルRSI平均逆転戦略は,異なる時間枠で2つのRSI指標を使用して,過剰購入および過剰販売条件を特定する傾向を追求する戦略である.この戦略は,過剰販売条件の後に長く,過剰購入条件の後にショートに行くことで平均逆転を資本することを目的としている.この戦略は,ハイキン・アシのキャンドル,RSI指標,開かれたカラーフィルターを利用して取引機会を特定する.
戦略の論理
この戦略は,異なる期間の2つのRSIインジケーターを使用します. 1つは5分チャートと1時間は1時間チャートです. RSIインジケーターでは,超売りレベルが30以下,超買いレベルが70以上と識別されます.
RSI値を追跡し,RSIが30以下または70を超えた場合を特定数値のバーで追跡し,延長された過売りまたは過買い状態を示します.
さらに,ハイキン・アシのキャンドルを使用し,トレードに入る前にトレンド方向を確認するために,緑色または赤色のキャンドルの数をチェックします.開いたカラーフィルターは誤った信号を避けるのに役立ちます.
RSIとハイキン・アシの両方の条件が一致すると 戦略は過売り条件の後に長引くか 過買い条件の後に短引くか 平均値への逆転を賭けます
取引を一夜にしておくのを避けるため,各日の終わりにポジションは閉鎖されます.
利点
- 超買/超売条件を特定するために多時間枠アプローチを使用する
- ハイキン・アシ の ろうそく は 騒音 を フィルタリング し て 傾向 の 方向 を 特定 する
- オープンカラーフィルターは偽信号を避ける
- 明確な入国/退出規則が 2つの指標を基に
- リスク管理は,各日の終わりまでにポジションを閉じる
リスク
- RSI の 超買/超売 信号 の 後,強烈 な 傾向 が 持続 する 場合,ウィップソー が 可能 です.
- 市場格差が停止を誘発する
- ハイキン・アシの遅延は,取引のエントリーを遅らせて,見逃した動きを引き起こします.
- 日末にポジションを閉じる場合,オバーナイト・ホールディングの潜在的利益が失われます.
改良
- 信号の確認のためにボリュームや変動などの追加のフィルターを追加します
- RSI 期間の最適化と,楽器の過剰購入/過剰販売レベル
- 動的ポジションのサイズを変動性に基づいて考える.
- 日末の出口ではなく,利益目標や遅延停止で実験する.
- 異なる計測器で試験効果とパラメータ調整
結論
双 RSI 平均逆転戦略は,取引勢力のルールに基づくアプローチをとる. 2 つのタイムフレーム,オーバーバイト/オーバーセール指標,キャンドルスタック分析およびエントリーフィルターを組み合わせることで,高い確率の平均逆転セットアップを特定することを目的としている. 厳格なリスク管理と慎重なポジションサイズリングは,引き下げ管理と利益のバランスをとるのに役立ちます.さらなる最適化と強度テストは,さまざまな市場でそれを成功裏に展開するのに役立ちます.
/*backtest
start: 2023-09-01 00:00:00
end: 2023-09-30 23:59:59
period: 1h
basePeriod: 15m
exchanges: [{"eid":"Futures_Binance","currency":"BTC_USDT"}]
*/

//Gidra
//2018

//@version=2
strategy(title = "Gidra's Vchain Strategy v0.1", shorttitle = "Gidra's Vchain Strategy v0.1", overlay = false, default_qty_type = strategy.percent_of_equity, default_qty_value = 100, pyramiding = 100)

//Settings
needlong = input(true, defval = true, title = "Long")
needshort = input(true, defval = true, title = "Short")
capital = input(100, defval = 100, minval = 1, maxval = 10000, title = "Lot, %")
rsiperiod = input(14, defval = 14, minval = 2, maxval = 100, title = "RSI period")
rsilimit = input(30, defval = 30, minval = 1, maxval = 50, title = "RSI limit")
rsibars = input(3, defval = 3, minval = 1, maxval = 20, title = "RSI signals")
useocf = input(true, defval = true, title = "Use Open Color Filter")
openbars = input(2, defval = 2, minval = 1, maxval = 20, title = "Open Color, Bars")
showrsi = input(true, defval = true, title = "Show indicator RSI")
fromyear = input(2018, defval = 2018, minval = 1900, maxval = 2100, title = "From Year")
toyear = input(2100, defval = 2100, minval = 1900, maxval = 2100, title = "To Year")
frommonth = input(01, defval = 01, minval = 01, maxval = 12, title = "From Month")
tomonth = input(12, defval = 12, minval = 01, maxval = 12, title = "To Month")
fromday = input(01, defval = 01, minval = 01, maxval = 31, title = "From Day")
today = input(31, defval = 31, minval = 01, maxval = 31, title = "To Day")


//Heikin Ashi Open/Close Price
o=open
c=close
h=high
l=low
haclose = (o+h+l+c)/4
haopen = na(haopen[1]) ? (o + c)/2 : (haopen[1] + haclose[1]) / 2
hahigh = max (h, max(haopen,haclose))
halow = min (l, min(haopen,haclose))
col=haopen>haclose ? red : lime
plotcandle(haopen, hahigh, halow, haclose, title="heikin", color=col)

//RSI
uprsi = rma(max(change(close), 0), rsiperiod)
dnrsi = rma(-min(change(close), 0), rsiperiod)
rsi = dnrsi == 0 ? 100 : uprsi == 0 ? 0 : 100 - (100 / (1 + uprsi / dnrsi))
uplimit = 100 - rsilimit
dnlimit = rsilimit
rsidn = rsi < dnlimit ? 1 : 0
rsiup = rsi > uplimit ? 1 : 0

//RSI condition
rsidnok = highest(rsidn, rsibars) == 1? 1 : 0
rsiupok = highest(rsiup, rsibars) == 1? 1 : 0

//Color Filter
bar = haclose > haopen ? 1 : haclose < haopen ? -1 : 0
gbar = bar == 1 ? 1 : 0
rbar = bar == -1 ? 1 : 0
openrbarok = sma(gbar, openbars) == 1 or useocf == false
opengbarok = sma(rbar, openbars) == 1 or useocf == false

//Signals
up = openrbarok and rsidnok
dn = opengbarok and rsiupok

lot = strategy.position_size == 0 ? strategy.equity / close * capital / 100 : lot[1]

//Indicator RSI
colbg = showrsi == false ? na : rsi > uplimit ? red : rsi < dnlimit ? lime : na
bgcolor(colbg, transp = 20)

//Trading
if up
    strategy.entry("Long", strategy.long, needlong == false ? 0 : lot, when=(time > timestamp(fromyear, frommonth, fromday, 00, 00) and time < timestamp(toyear, tomonth, today, 23, 59)))

if dn
    strategy.entry("Short", strategy.short, needshort == false ? 0 : lot, when=(time > timestamp(fromyear, frommonth, fromday, 00, 00) and time < timestamp(toyear, tomonth, today, 23, 59)))

if time > timestamp(toyear, tomonth, today, 23, 59)// or exit
    strategy.close_all()
- 多要素量的な取引戦略
- 動向平均のクロスオーバーに基づく戦略をフォローする傾向
- ノロの価格チャネル戦略 v1.1
- 2つの移動平均逆転戦略
- トリプル パターン オシレーション 取引戦略
- トレンド逆転システム
- チャンネルブレイク SMA戦略
- RSIのトレンド逆転戦略
- RSI MACDクロスオーバー ダブルMA追跡戦略
- 複数のタイムフレームのトレンド戦略
- ハイキン・アシ (ROC) 百分比取引戦略
- 移動平均偏差に基づくトレンドブレイク戦略
- スナップバック 移動平均 反トレンド 戦略
- ゴールデンクロス・ロング戦略をフォローする移動平均傾向
- モメントブレイク戦略
- オープンドライブ戦略
- モメント・リバース・コンボ・戦略
- クロスオーバーマスター - 逆転ブレイアウト戦略
- イチモク・ラグング・クロス・デュアル・ライン・トレーディング・戦略
- 動力分解 MACD 戦略