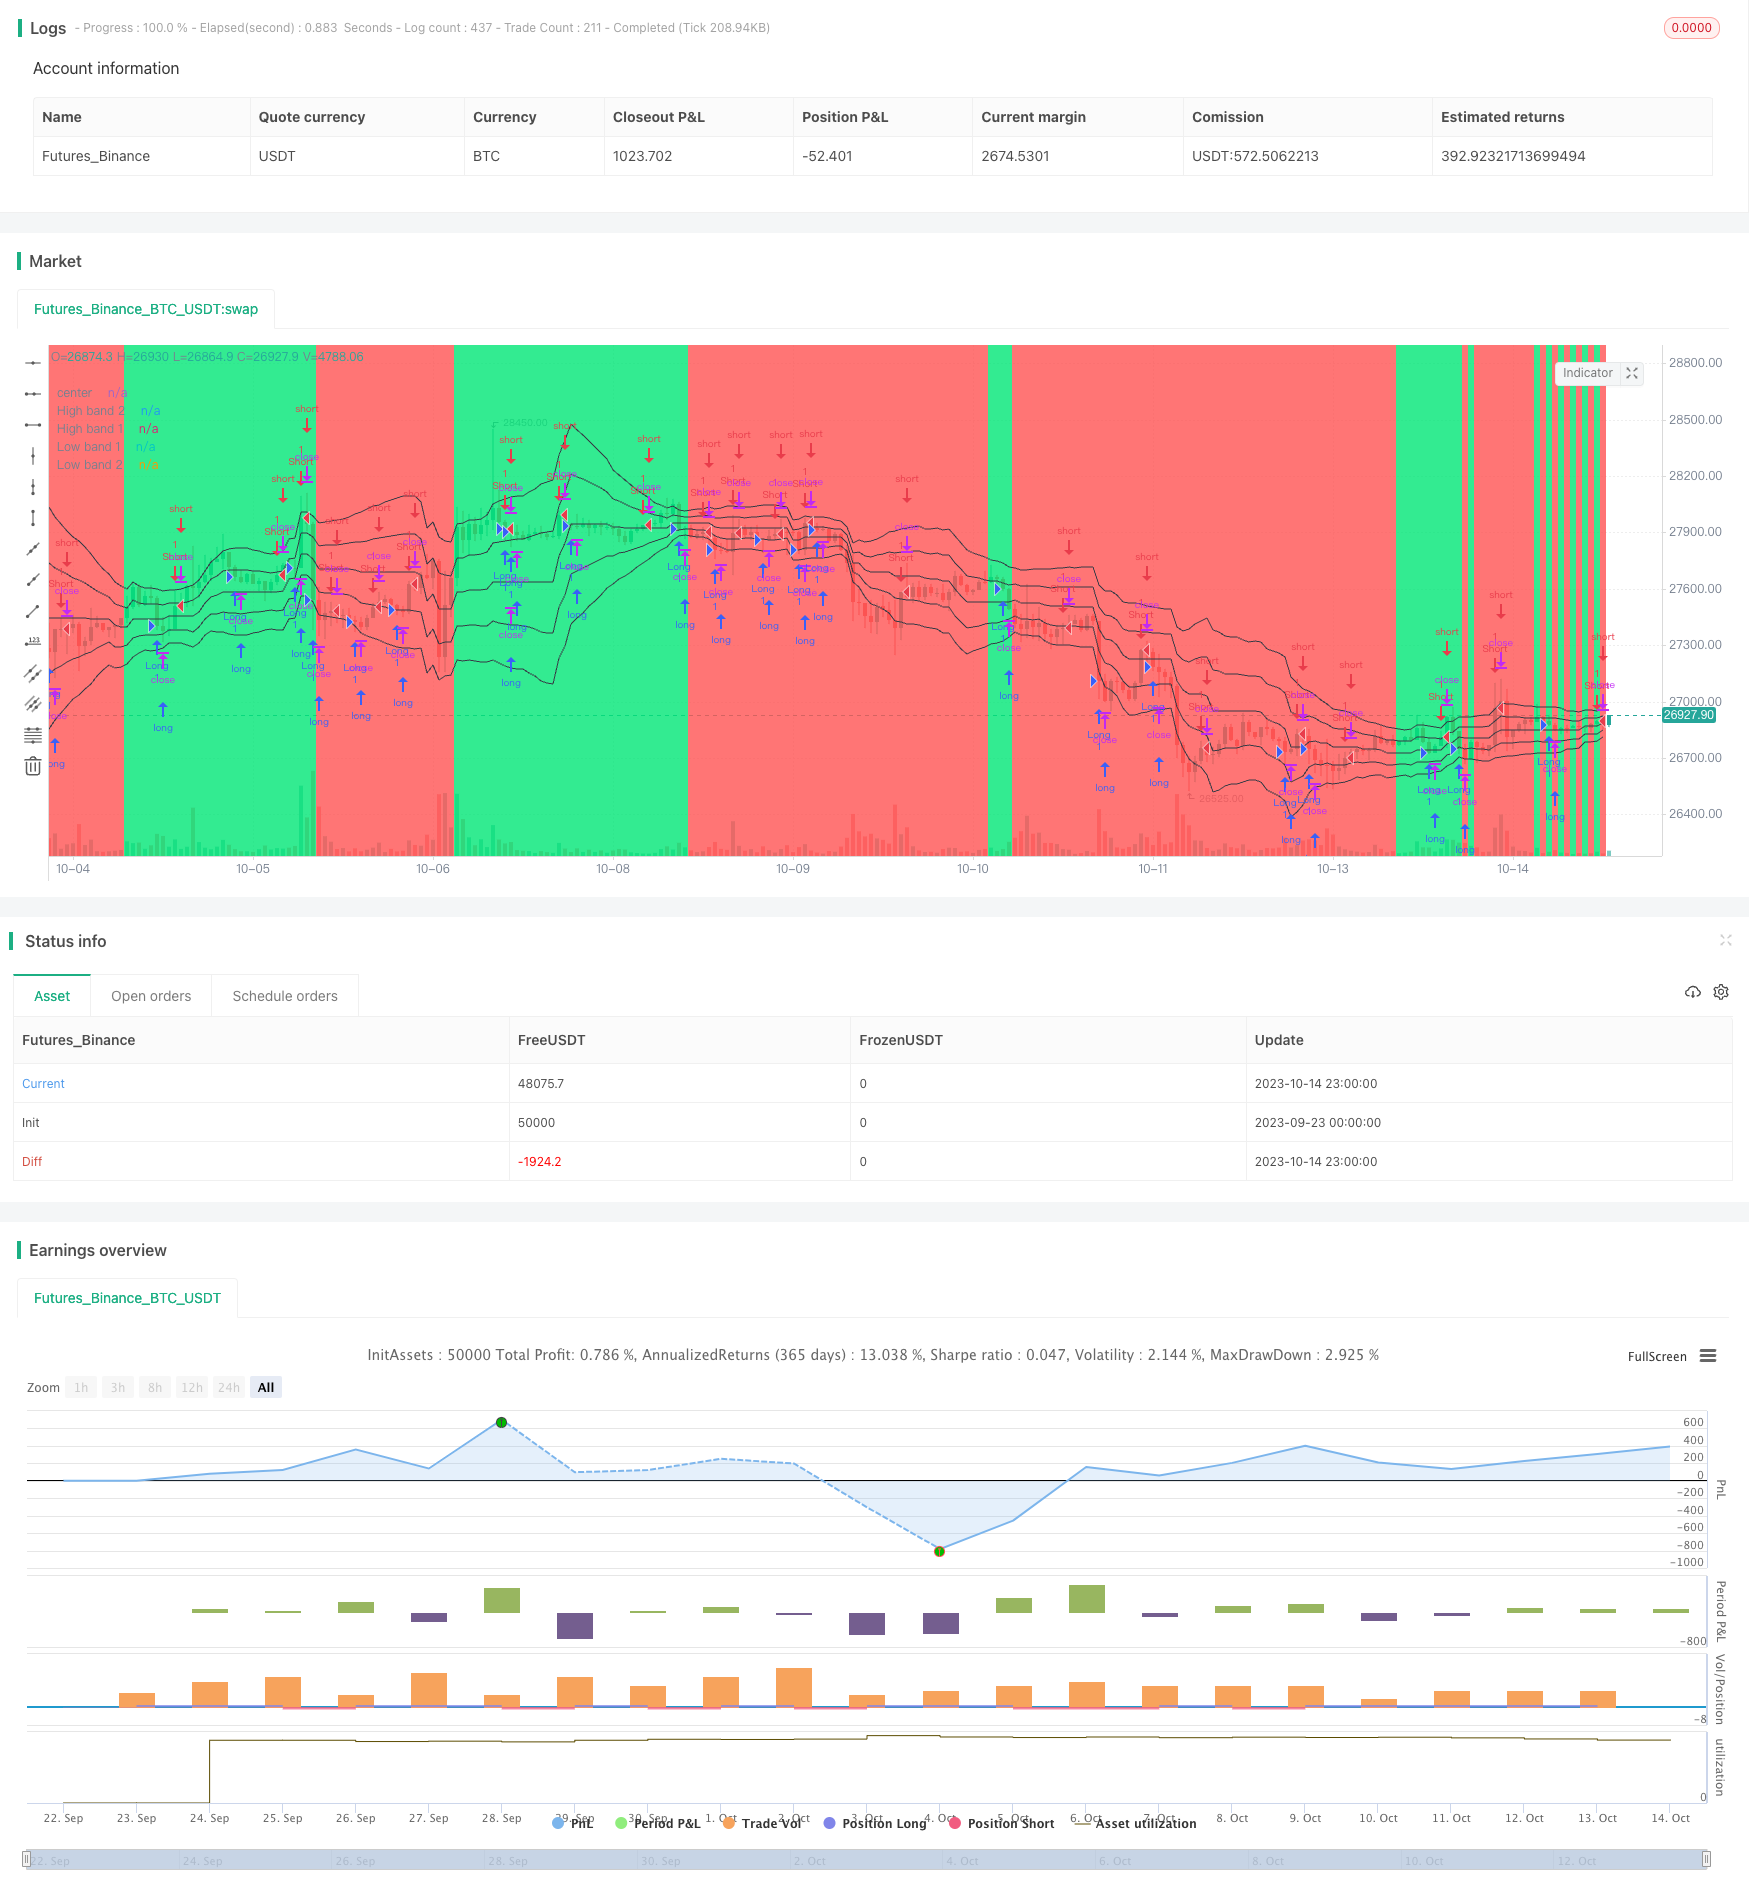
2つの移動平均線を逆転する戦略
作者: リン・ハーンチャオチャン, 日付: 2023年10月24日 10:56:08タグ:

概要
この戦略は,主に二重移動平均線を買い売り信号として利用し,トレンド逆転時に利益を得ます. 短期移動平均線が長移動平均線を横切る時,長移動平均線を横切る時,短移動平均線が長移動平均線を横切る時,空白を空切る時,多額のトレッキングストップ損失の戦略です.
戦略の原理
この戦略では,まず2つの移動平均線,より短い20日平均線,より長い60日平均線を設定し,その後,短期平均線と長期平均線の交差点を判断して入場を決定する.
具体的には,短期平均線が長期平均線を横切ると,現在上昇傾向にあることを示し,このとき多くを行う.短期平均線が長期平均線を下回っているとき,現在下落傾向にあることを示し,このとき空にする.
超空のストップはトラッキングストップで,最高価格と最低価格に基づいてトラリングストップを設定し,最大利益をロックします.
このコードの基本論理は以下の通りです.
- 20日EMAと60日EMAを計算する
- 20日のEMAが60日EMAを超えているかどうかを判断し,もしそうなら,それを増やしてください.
- 20日のEMAを60日EMAに切り替えるか判断し,もしそうなら空です.
- 複数のポジションに入ると,最高価格の3%でストップラインです.
- 低価格の3%で止損ラインとして空置に入ります.
- 持株でストップローズラインを継続的に調整する
優位性分析
この戦略には以下のような利点があります.
- シンプルでわかりやすいアイデアです.
- 偽突破を効果的にフィルタリングするために,2つの均線を使用します.
- ストップ・ロスの追跡により,最大利益をロックできます.
- 傾向が変わるときに信号を素早く捕捉できます.
- 撤収は適切に制御され,比較的安定している.
リスク分析
この戦略にはいくつかのリスクもあります:
- トレンドがはっきりしない場合,二重均線が頻繁に交差し,頻繁に取引損失を引き起こす可能性があります.
- 停止損耗範囲を正しく設定しない場合,停止損耗が過度に緩やかまたは過度に激烈になる可能性があります.
- パラメータを設定すると,周期長が誤りになり,重要な信号点が失われる可能性があります.
- 取引費用が高く,利益の余地に影響します.
リスクに対する最適化は,次の方法によって行われます:
- 傾向がはっきりしない場合,フィルタリングシステムを採用し,盲目取引を避ける.
- 止損範囲をテストし最適化し,適切な止損範囲を設定します.
- パラメータ設定の最適設定は,再テストとパラメータ調整によって求められる.
- 取引手数を適切に削減し,取引手数料を削減する.
思考を最適化する
この戦略は,以下のいくつかの点でさらに最適化することができます:
他の指標のフィルタリングを追加し,多条件入場メカニズムを作り,偽突破を避ける.例えば,RSI指標の決定に参加することができます.
移動均線の周期パラメータを最適化し,最適なパラメータ組み合わせを見つけます.
停止損耗範囲を最適化します. 復測データから最適な停止損耗範囲を計算できます. 動的な停止損耗範囲を設定することもできます.
再入場メカニズムを設定する.停止損失退出後に合理的な再入場ロジックを設定し,取引数を減らす.
トレンド判断指標を組み合わせ,トレンドが明らかでないときに取引を一時停止し,不効な取引を避ける.
ポジション管理メカニズムに参加し,市場の状況に応じてポジションとストップ損失範囲を動的に調整します.
概要
双均線移動平均逆転戦略は,全体的に比較的シンプルで実用的なもので,双均線判断によるトレンドターニングポイントは,一般的な方法であり,有効な方法である.しかし,一定のリスクがあり,パラメータ設定とストップ損失範囲の最適化テスト,および他のフィルタリング指標と併用して併用する必要があり,戦略が最大限に有効になる.細かな最適化と厳格なリスク管理を経て,この戦略は安定して収益性の高い波段取引戦略となることができる.
/*backtest
start: 2023-09-23 00:00:00
end: 2023-10-15 00:00:00
period: 1h
basePeriod: 15m
exchanges: [{"eid":"Futures_Binance","currency":"BTC_USDT"}]
*/


//@version=2
strategy("Noro's Bands Scalper Strategy v1.4", shorttitle = "Scalper str 1.4", overlay=true, default_qty_type = strategy.percent_of_equity, default_qty_value=100.0, pyramiding=0)

//Settings
needlong = input(true, defval = true, title = "Long")
needshort = input(true, defval = true, title = "Short")
takepercent = input(0, defval = 0, minval = 0, maxval = 1000, title = "take, %")
needbe = input(true, defval = true, title = "Bands Entry")
needct = input(false, defval = false, title = "Counter-trend entry")
needdb = input(true, defval = true, title = "Double Body")
len = input(20, defval = 20, minval = 2, maxval = 200, title = "Period")
needbb = input(true, defval = true, title = "Show Bands")
needbg = input(true, defval = true, title = "Show Background")
src = close

//PriceChannel 1
lasthigh = highest(src, len)
lastlow = lowest(src, len)
center = (lasthigh + lastlow) / 2

//Distance
dist = abs(src - center)
distsma = sma(dist, len)
hd = center + distsma
ld = center - distsma
hd2 = center + distsma * 2
ld2 = center - distsma * 2

//Trend
trend = close < ld and high < center ? -1 : close > hd and low > center ? 1 : trend[1]

//Lines
colo = needbb == false ? na : black
plot(hd2, color = colo, linewidth = 1, transp = 0, title = "High band 2")
plot(hd, color = colo, linewidth = 1, transp = 0, title = "High band 1")
plot(center, color = colo, linewidth = 1, transp = 0, title = "center")
plot(ld, color = colo, linewidth = 1, transp = 0, title = "Low band 1")
plot(ld2, color = colo, linewidth = 1, transp = 0, title = "Low band 2")

//Background
col = needbg == false ? na : trend == 1 ? lime : red
bgcolor(col, transp = 80)

//Body
body = abs(close - open)
smabody = needdb == false ? ema(body, 30) : ema(body, 30) * 2
candle = high - low

//Signals
bar = close > open ? 1 : close < open ? -1 : 0
up7 = trend == 1 and ((bar == -1 and bar[1] == -1) or (body > smabody and bar == -1)) ? 1 : 0
dn7 = trend == 1 and ((bar == 1 and bar[1] == 1) or (close > hd and needbe == true)) and close > strategy.position_avg_price * (100 + takepercent) / 100 ? 1 : 0
up8 = trend == -1 and ((bar == -1 and bar[1] == -1) or (close < ld2 and needbe == true)) and close < strategy.position_avg_price * (100 - takepercent) / 100 ? 1 : 0
dn8 = trend == -1 and ((bar == 1 and bar[1] == 1) or (body > smabody and bar == 1)) ? 1 : 0

if up7 == 1 or up8 == 1
    strategy.entry("Long", strategy.long, needlong == false ? 0 : trend == -1 and needct == false ? 0 : na)

if dn7 == 1 or dn8 == 1
    strategy.entry("Short", strategy.short, needshort == false ? 0 : trend == 1 and needct == false ? 0 : na)
- 低価格で購入し,高価格で販売する戦略を追跡する
- 均線交差とMACDの組み合わせ戦略
- 動力指標 移動平均線 交差傾向追跡戦略
- 横断戦略
- 双均線転向ポイント取引戦略
- パウェル・インデックスが急突破戦略
- ストップ損失移動平均戦略を追跡する
- 多要素量化取引戦略
- マルチ空間の戦略を横断する均線
- Noro's 値道戦略 v1.1
- トリプルモード・ショッキング・トレード戦略
- トレンド・ショッキング・ターニングポイント・システム
- 2つの均線通路がSMA戦略を突破する
- RSIのトレンド逆転戦略
- RSI MACD 交差双均線追跡戦略
- 多時間枠のトレンド戦略
- 双方向RSI均線応答戦略
- ハイキン・アシ ROC パーセントに基づく取引戦略
- 分散運動平均値に基づいたトレンドブレイク戦略
- 移動平均回抽出戦略