多角形の移動平均戦略
作者: リン・ハーンチャオチャン開催日:2023年10月31日 14:53:50タグ:

概要
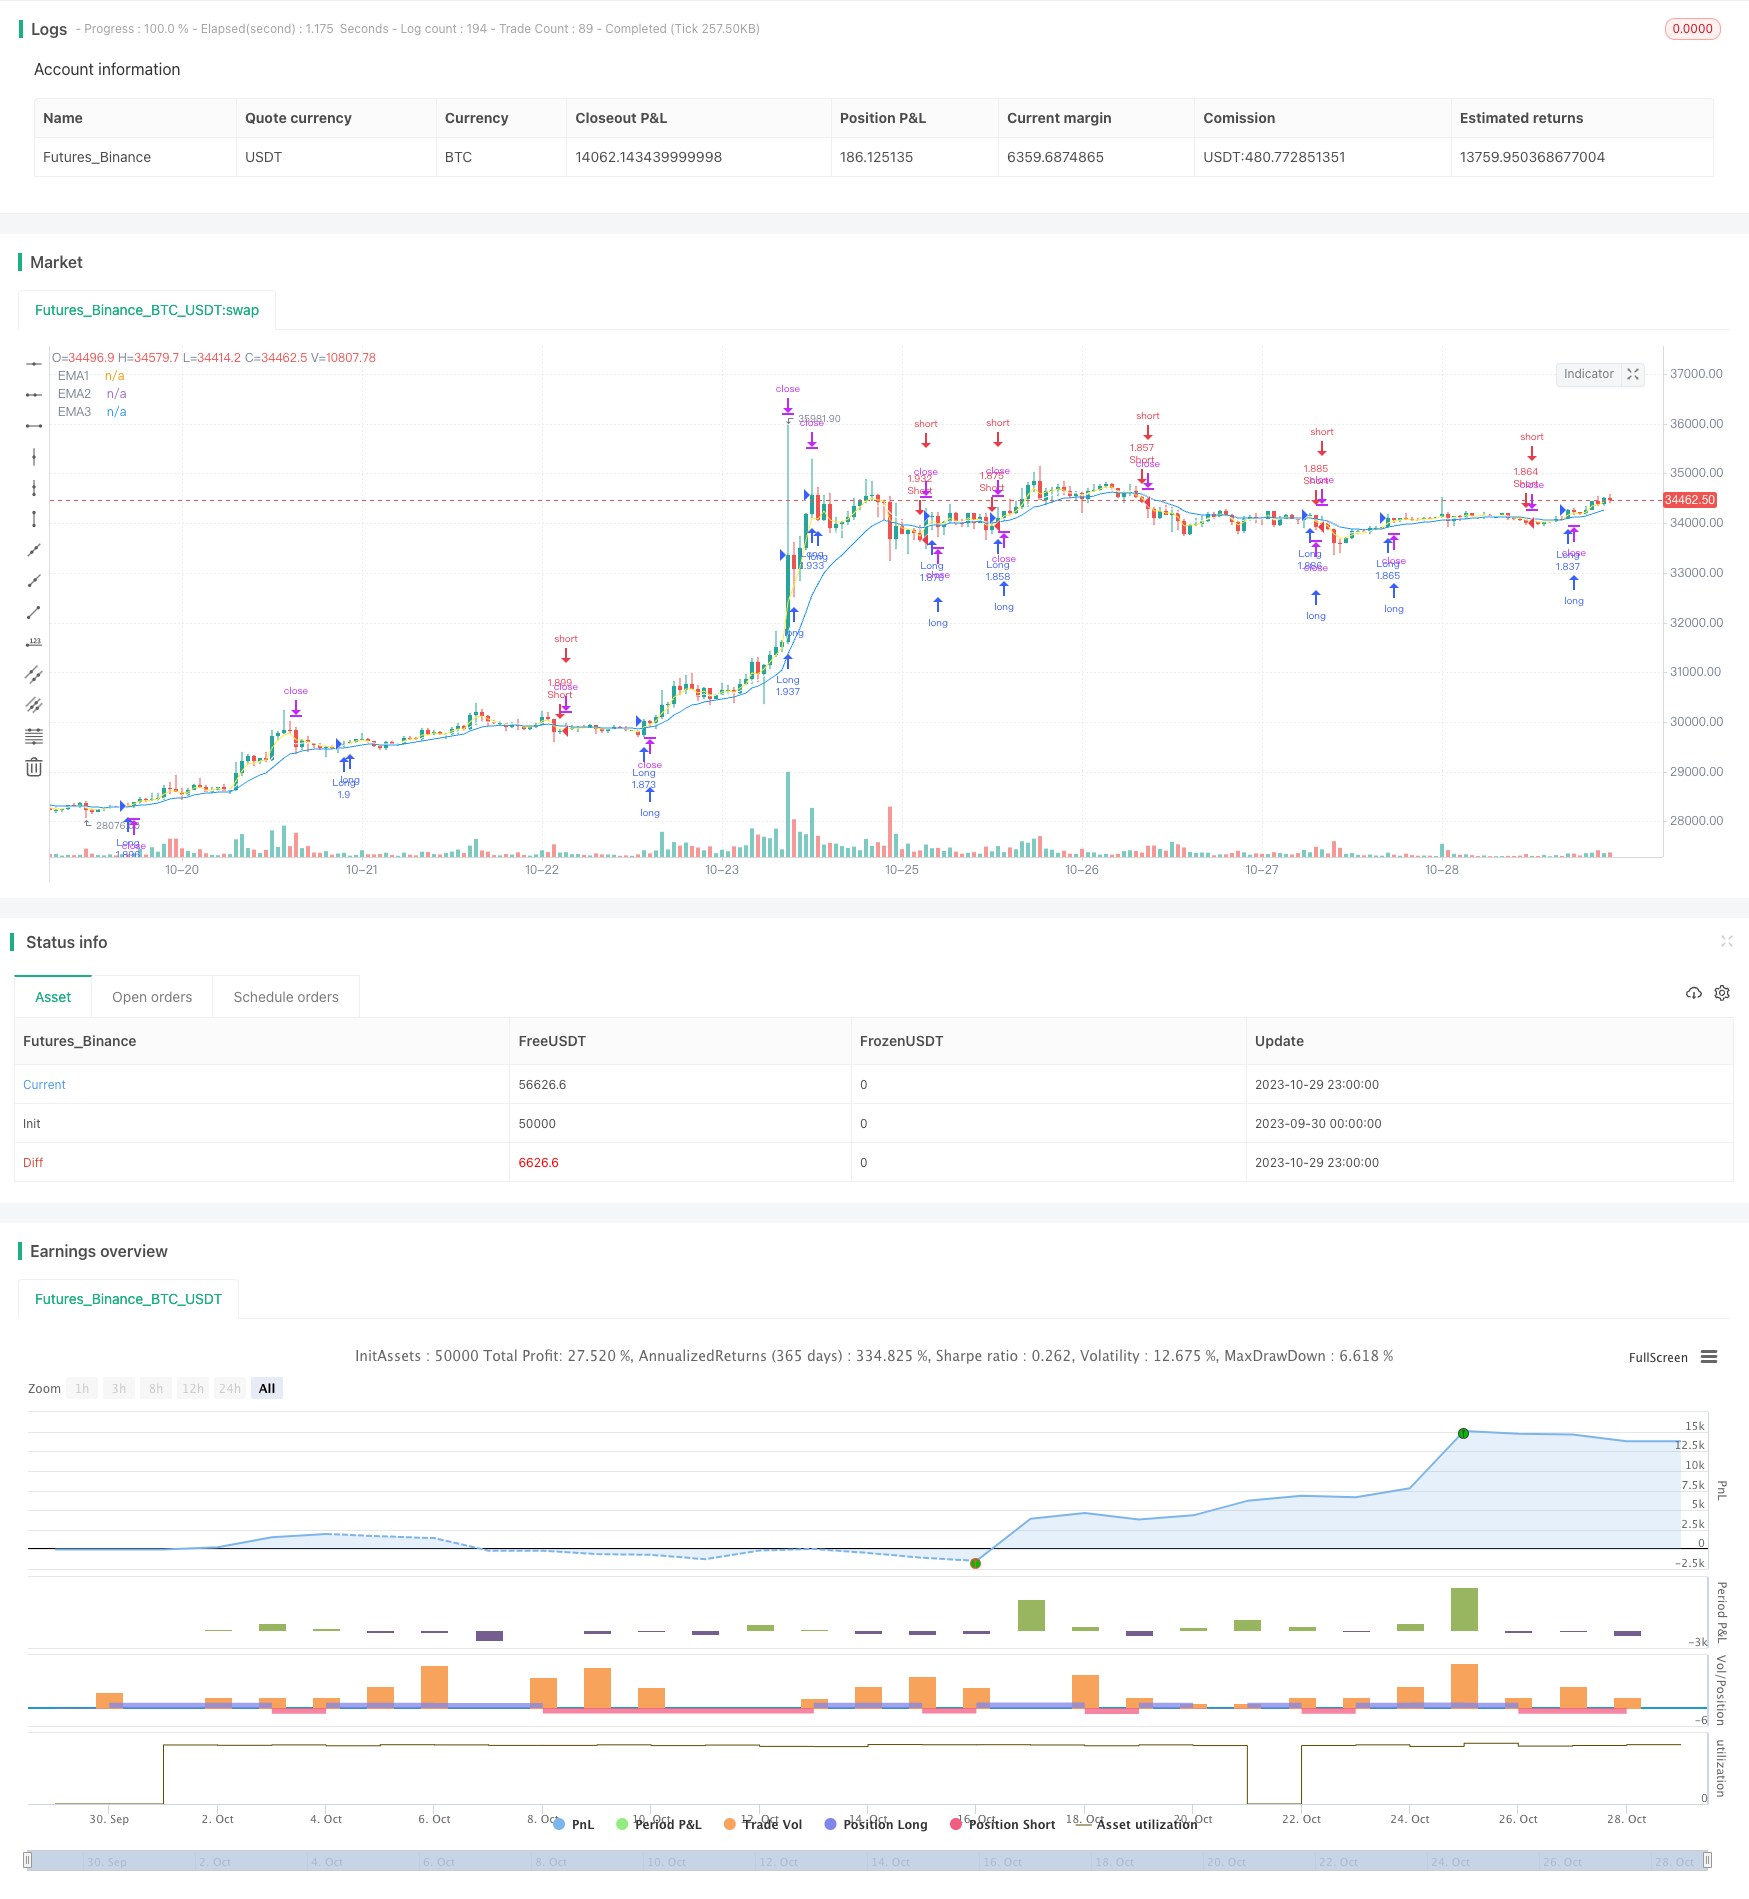
ポリゴン・ムービング・アベア戦略は,異なる期間の複数の移動平均値を持つポリゴンを構築し,ポリゴンの突破を取引信号として使用する.このトレンドフォロー戦略は複数のタイムフレームを組み込み,市場のノイズを効果的にフィルタリングし,主要なトレンドを捉える.
戦略の論理
この戦略は,3期,7期および13期EMAなどの複数のEMAをプロットし,多角形チャネルを形成する.価格がEMAを超えると,長い信号が生成される.価格がEMAを下回ると,短い信号が生成される.これは多くの偽のブレイクを避けるのに役立ちます.
このコードは,閉じる価格とEMAを比較することで突破信号を決定する. Close>ema1とema1>ema2とema2>ema3のような条件を使用する.時間条件 time_condはバックテスト期間を制限するために追加される.この戦略は,エントリー後に利益を保護するためにトライリングストップロスを使用する.
利点
この戦略の最大の利点は,騒音を避けるためにフィルターとして複数の移動平均を使用して,主要なトレンド方向を効果的に把握する能力です.
リスク と 解決策
主なリスクは,この戦略がトレンド逆転点を特定できず,トレンド逆転中に損失をもたらす可能性があることです.不適切なMA期間設定は,オーバートレードまたは遅延信号を引き起こす可能性があります.MA組み合わせを最適化し,逆転指標を追加し,ストップ損失範囲を拡大することによってリスクを軽減することができます.
オプティマイゼーションの方向性
戦略は以下の側面で最適化できます.
-
最適な組み合わせを見つけるために MA 期間を最適化します
-
RSIやMACDのような逆転指標を追加して 取引を間に合うようにします
-
停止損失範囲とオフセットを最適化して,早期停止損失を減らす.
-
適応性を向上させるために,異なる製品のパラメータを最適化します.
概要
ポリゴン・ムービング・アベア戦略は,一般的に信頼性と効果のあるトレンドフォローシステムです. その最大の強みは,ノイズを大幅にフィルタリングしながらメイントレンドをキャプチャすることです. しかし,逆転を特定する上でいくつかの制限があります. パラメータ最適化,補助指標を追加などによって改善することができます. 明らかなトレンドを持つ市場に適しており,適切に使用すると安定した利益を生むことができます.
/*backtest
start: 2023-09-30 00:00:00
end: 2023-10-30 00:00:00
period: 1h
basePeriod: 15m
exchanges: [{"eid":"Futures_Binance","currency":"BTC_USDT"}]
*/

// This source code is subject to the terms of the Mozilla Public License 2.0 at https://mozilla.org/MPL/2.0/
// © Crypto-Oli

//@version=4
strategy("BLANK Strategy + TSL", initial_capital=5000, default_qty_type=strategy.percent_of_equity, default_qty_value=100, commission_type=strategy.commission.percent, pyramiding=1, commission_value=0.075, overlay=true)

////////////////////////////////////////////////////////////////////////////////
// BACKTESTING RANGE

// From Date Inputs
fromDay = input(defval = 1, title = "From Day", minval = 1, maxval = 31)
fromMonth = input(defval = 1, title = "From Month", minval = 1, maxval = 12)
fromYear = input(defval = 2019, title = "From Year", minval = 1970)

// To Date Inputs
toDay = input(defval = 1, title = "To Day", minval = 1, maxval = 31)
toMonth = input(defval = 1, title = "To Month", minval = 1, maxval = 12)
toYear = input(defval = 2020, title = "To Year", minval = 1970)

// Calculate start/end date and time condition
startDate = timestamp(fromYear, fromMonth, fromDay, 00, 00)
finishDate = timestamp(toYear, toMonth, toDay, 00, 00)
time_cond = true

////////////////////////////////////////////////////////////////////////////////


/// YOUR INPUTS BELOW - DELET EXAPLES ///


ema1=ema(close,input(3))
ema2=ema(close,input(7))
ema3=ema(close,input(13))


/// PLOTS IF YOU NEED BELOW - DELET EXAPLES ///


plot(ema1, "EMA1", color.yellow)
plot(ema2, "EMA2", color.white)
plot(ema3, "EMA3", color.blue)


/// YOUR CONDITIONS BELOW - DELET EXAPLES ///


longCondition = close>ema1 and ema1>ema2 and ema2>ema3 and time_cond
shortCondition = close<ema1 and ema1<ema2 and ema2<ema3 and time_cond

/// EXECUTION ///


if (longCondition)
    strategy.entry("Long", strategy.long)
strategy.exit("Long Exit", "Long", trail_points = close * 0.05 / syminfo.mintick, trail_offset = close * 0.02 / syminfo.mintick)

if (shortCondition)
    strategy.entry("Short", strategy.short)
strategy.exit("Short Exit", "Short", trail_points = close * 0.05 / syminfo.mintick, trail_offset = close * 0.02 / syminfo.mintick)
- ボリンジャー・バンドのトレンド逆転戦略
- 関連性に基づく上昇/下落の暗号取引戦略 ウォール街CCI指数に基づく
- SMI エルゴジックオシレーターモメント取引戦略
- ドンチアン・チャネルに基づく戦略を踏まえた傾向
- ローズクロススター・デュアル・インディケーター・ボラティリティ戦略
- アダプティブATRトレンドブレイク戦略
- ボリンジャー・バンド・モメンタム・バースト戦略
- 多要素戦略
- 定期的な投資に基づくゴールデントレンド追跡戦略
- イチモク・キンコ・ヒョウ 十字戦略
- Pivot Detector オシレーター トレンド トレーディング 戦略
- バリアンスリバーション取引戦略
- EMAクロスオーバーに基づくトレンド・トレーディング戦略
- ボリンジャーバンド逆転振動トレンド戦略
- EMAとMAMA指標に基づく取引戦略
- エラーズの主要指標取引戦略
- 移動平均値に基づいたトレンドフォロー戦略
- レレデック DEC 戦略
- Auto Buy Scalper 戦略でストカスティックRSI
- 拡張性のあるブレイクアウト取引戦略