雲の向こうの戦略
作者: リン・ハーンチャオチャン,日付: 2023年11月3日 16:10:33タグ:

概要
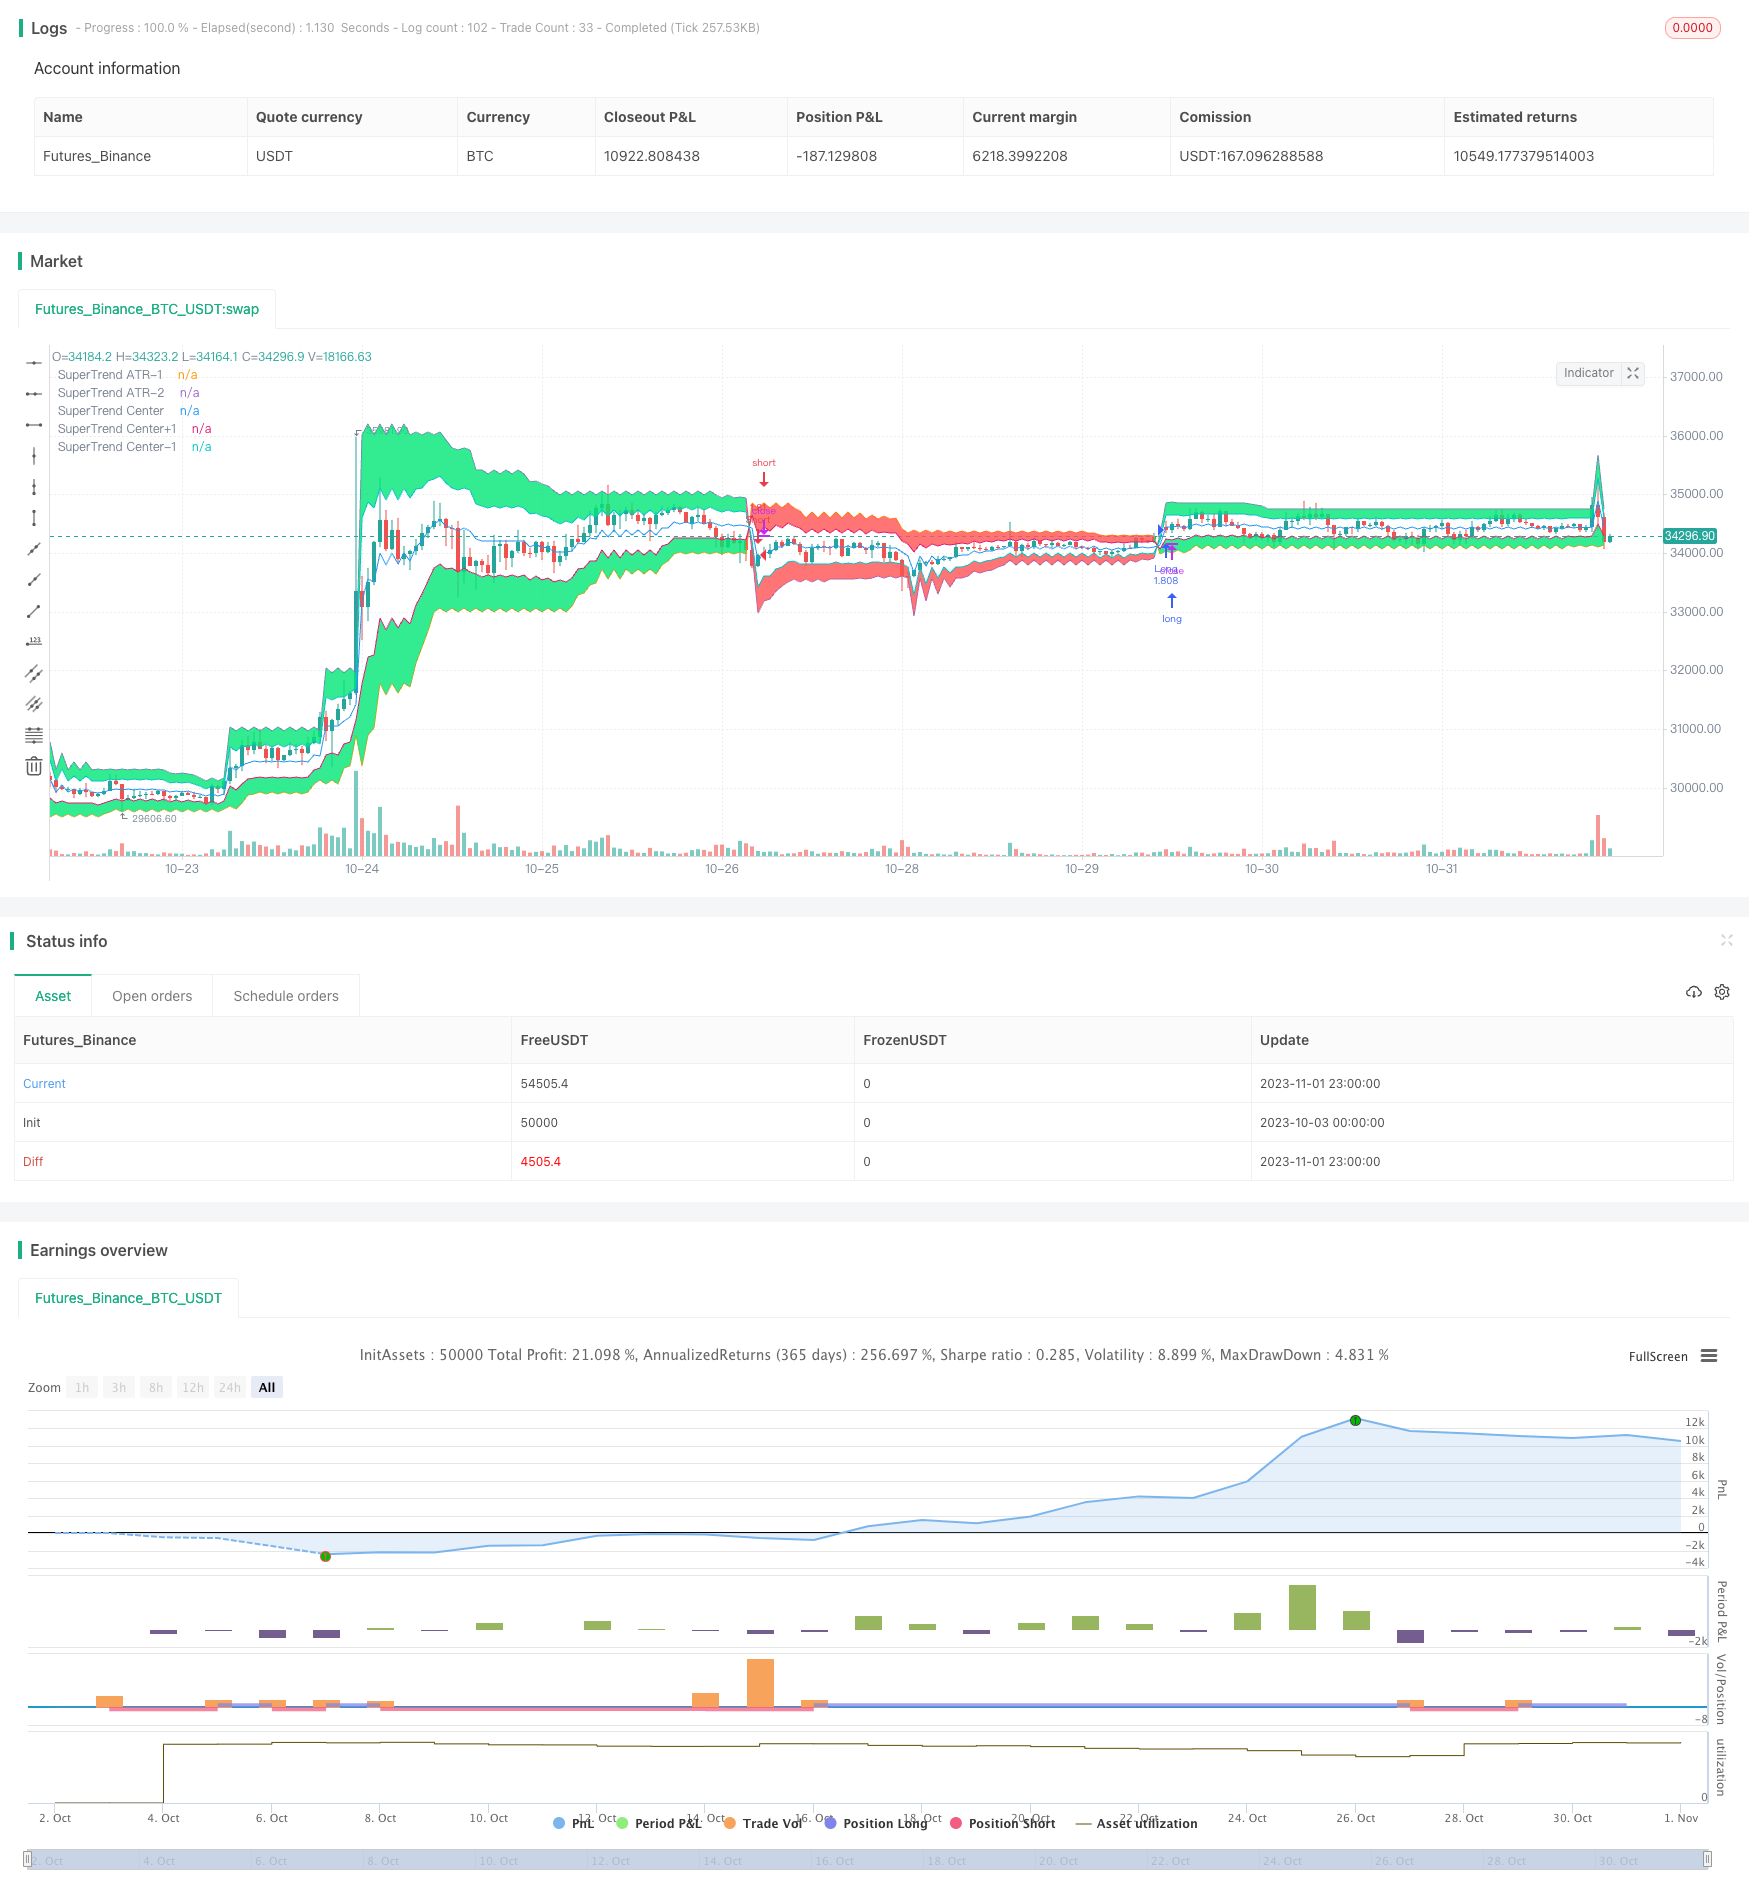
この戦略は,オーダーを配置するのに役立つスーパートレンドインジケーターを使用し,収益性を高めるためにクラウド層やキャンドルスタイク色のフィルターを使用して制限オーダーを配置する.その目標は,トレンドが開始後すぐに把握し,統合中にリスクを軽減することです.
戦略の論理
-
ATR 期間中の最高値と最低値の平均をベースラインとして計算する.
-
高値と低値の帯を因子倍数に基づいて計算する.
-
上部帯の上にある場合は 1 とマークします 下部帯下にある場合は -1 とマークします そうでなければ前の状態を維持します
-
ストップ・ロスのラインを,上/下帯に対する閉値
の位置に基づいて動的に調整します. -
雲層の範囲を計算する.上部/下部帯の一定割合に基づいて計算する.
-
超トレンドが−1であるとき ストロングはストロング=オープンです
-
前回のバーの閉じる価格で長期に制限買い注文を置く.短期に制限売り注文を置く.
-
時間帯でフィルターして 可能な位置をすべて閉じる
利点分析
この戦略は,スーパートレンドとクラウドコンセプトを組み合わせ,トレンド開始後も迅速なトレンドキャプチャを可能にします.スーパートレンドストップ損失は通常の移動ストップ損失よりも早く反応します.クラウド層は偽ブレイクによる損失を回避します.リーミットオーダーは滑り込みを軽減し,収益性を高めます.主な利点は:
-
スーパートレンドは敏感で 傾向を追跡します
-
雲層フィルタは 偽爆破による損失を減らす
-
ろうそくの色は逆転を避けるのに役立ちます.
-
制限オーダーは スリップ効果を減らし 勝利率を上げます
-
調整可能な時間帯とポジション管理は,異なる取引ニーズに適しています.
リスク分析
また,注意すべきリスクもあります.
-
誤ったスーパートレンドパラメータは 敏感度や ショットダウンを 引き起こす可能性があります
-
過剰な雲の範囲は有効なブレイクアウト信号をフィルタリングし,収益性に影響を与えます
-
高波動や機会の逃れで 制限オーダーが満たされない可能性があります
-
ストップ・ロスはシステムリスクや 莫大な損失を完全に回避できません
-
リスクをコントロールする必要がある
オプティマイゼーションの方向性
この戦略は,次の側面で改善できます.
-
異なる市場とインストラクションをテストして,最適なスーパートレンドパラメータを探します.
-
市場変動に基づいてストップロスのレベルを動的に調整する.
-
音のフィルタリングと信号保持のバランスをとるために 雲の範囲を最適化します
-
ポジションのサイズを市場条件に基づいて動的にサイズするモジュールを追加します.
-
市場リズムに適応するために,異なる取引セッションに異なるパラメータセットを使用します.
-
他の指標と組み合わせた場合の試験効果
結論
結論として,この戦略は,トレンドキャッチにおける明確な論理性と明らかな利点を持っています. しかし,いかなる戦略もシステムリスクを完全に回避することはできません. ポジションのサイズを制御し,ライブトレーディングにおけるリスクを最小限に抑え,エッジを最大化するために最適化し続けなければなりません. この戦略は,進化する市場動態に適応するために,さらなるテストと強化の可能性が大きい.
/*backtest
start: 2023-10-03 00:00:00
end: 2023-11-02 00:00:00
period: 1h
basePeriod: 15m
exchanges: [{"eid":"Futures_Binance","currency":"BTC_USDT"}]
*/

//Noro
//2018

//@version=2
strategy("Noro's SuperTrend Strategy v2.0 Limit", shorttitle = "STL str", overlay = true, default_qty_type = strategy.percent_of_equity, default_qty_value = 100, pyramiding = 0)

//Settings
needlong = input(true, defval = true, title = "Long")
needshort = input(true, defval = true, title = "Short")
capital = input(100, defval = 100, minval = 1, maxval = 10000, title = "Lot, %")
cloud = input(25, defval = 25, minval = 5, maxval = 50, title = "cloud, % of ATR")
Factor = input(title = "Super Trend", defval = 3, minval = 1, maxval = 100)
ATR = input(title = "ATR", defval = 7, minval = 1,maxval = 100)
centr = input(true, defval = true, title = "need center of ATR?")
border = input(false, defval = false, title = "need border?")
fromyear = input(1900, defval = 1900, minval = 1900, maxval = 2100, title = "From Year")
toyear = input(2100, defval = 2100, minval = 1900, maxval = 2100, title = "To Year")
frommonth = input(01, defval = 01, minval = 01, maxval = 12, title = "From Month")
tomonth = input(12, defval = 12, minval = 01, maxval = 12, title = "To Month")
fromday = input(01, defval = 01, minval = 01, maxval = 31, title = "From day")
today = input(31, defval = 31, minval = 01, maxval = 31, title = "To day")

//Super Trend ATR 1
src = close
Up=hl2-(Factor*atr(ATR))
Dn=hl2+(Factor*atr(ATR))
TUp=close[1]>TUp[1]? max(Up,TUp[1]) : Up
TDown=close[1]<TDown[1]? min(Dn,TDown[1]) : Dn
Trend = close > TDown[1] ? 1: close< TUp[1]? -1: nz(Trend[1],1)
Tsl1 = Trend==1? TUp: TDown
Tsl2 = Trend==1? TDown: TUp
limit = (Tsl1 - Tsl2) / 100 * cloud
upcloud = Tsl1 - limit
dncloud = Tsl2 + limit

//Cloud
linecolor = Trend == 1 ? green : red
centercolor = centr == true ? blue : na
cloudcolor = Trend == 1 ? green : red
cline = (Tsl1 + Tsl2) / 2
P1 = plot(Tsl1, color = border == false ? na : linecolor , style = line , linewidth = 1,title = "SuperTrend ATR-1")
P2 = plot(Tsl2, color = border == false ? na : linecolor , style = line , linewidth = 1,title = "SuperTrend ATR-2")
P3 = plot(cline, color = centercolor , style = line , linewidth = 1,title = "SuperTrend Center")
P4 = plot(upcloud, color = border == false ? na : linecolor , style = line , linewidth = 1,title = "SuperTrend Center+1")
P5 = plot(dncloud, color = border == false ? na : linecolor , style = line , linewidth = 1,title = "SuperTrend Center-1")
fill(P1, P4, color = linecolor == red ? red : lime, transp = 50)
fill(P2, P5, color = linecolor == red ? red : lime, transp = 50)

//Signals
up = 0.0
dn = 0.0
up := Trend != 1 ? 0 : Trend == 1 and close < open ? close : up[1]
dn := Trend != -1 ? close * 1000 : Trend == -1 and close > open ? close : dn[1]

//Trading
size = strategy.position_size
lot = 0.0
lot := size != size[1] ? strategy.equity / close * capital / 100 : lot[1]
if true
    strategy.entry("Long", strategy.long, needlong ? lot : 0, limit = up, when = (Trend == 1 and time > timestamp(fromyear, frommonth, fromday, 00, 00) and time < timestamp(toyear, tomonth, today, 23, 59)))
    strategy.entry("Short", strategy.short, needshort ? lot : 0, limit = dn, when = (Trend == -1 and time > timestamp(fromyear, frommonth, fromday, 00, 00) and time < timestamp(toyear, tomonth, today, 23, 59)))

if time > timestamp(toyear, tomonth, today, 23, 59)
    strategy.close_all()
- 統合戦略の転換
- 移動平均のクロスオーバー戦略
- 二重脱出戦略
- クロス・リーミット・オーダー・クロス・ピリオド・トレーディング・ストラテジー
- イチモク ストップ・ロスト戦略
- ケルトナーチャンネル トレンドベース戦略
- カロベイン平均逆転によるスケール標準化ベクトル戦略
- 2つの移動平均逆転戦略
- 日中のピボットブレイクストラテジー
- 木星と土星 モメントMA クロスオーバー フィルタリング戦略
- 暗黒取引戦略
- トレンドブレイク 移動平均追跡戦略
- ボリュームオシレーターに基づくトレンド追跡戦略
- スーパートレンドとフィッシャー・トランスフォーメーションに基づく長期戦略をフォローする傾向
- 双重ゴールドクロス逆転取引戦略
- フィボナッチは取引戦略の脚本を撤回する
- RSI-BB モメントブレイクストラテジー
- ブレイクバンド 固定ストップ損失戦略
- RSIとスーパートレンドに基づく二方向取引戦略
- EMA 13 48 戦略をフォローする傾向