二重影逆転戦略
作者: リン・ハーンチャオチャン開催日:2023年11月7日17時52分タグ:

概要
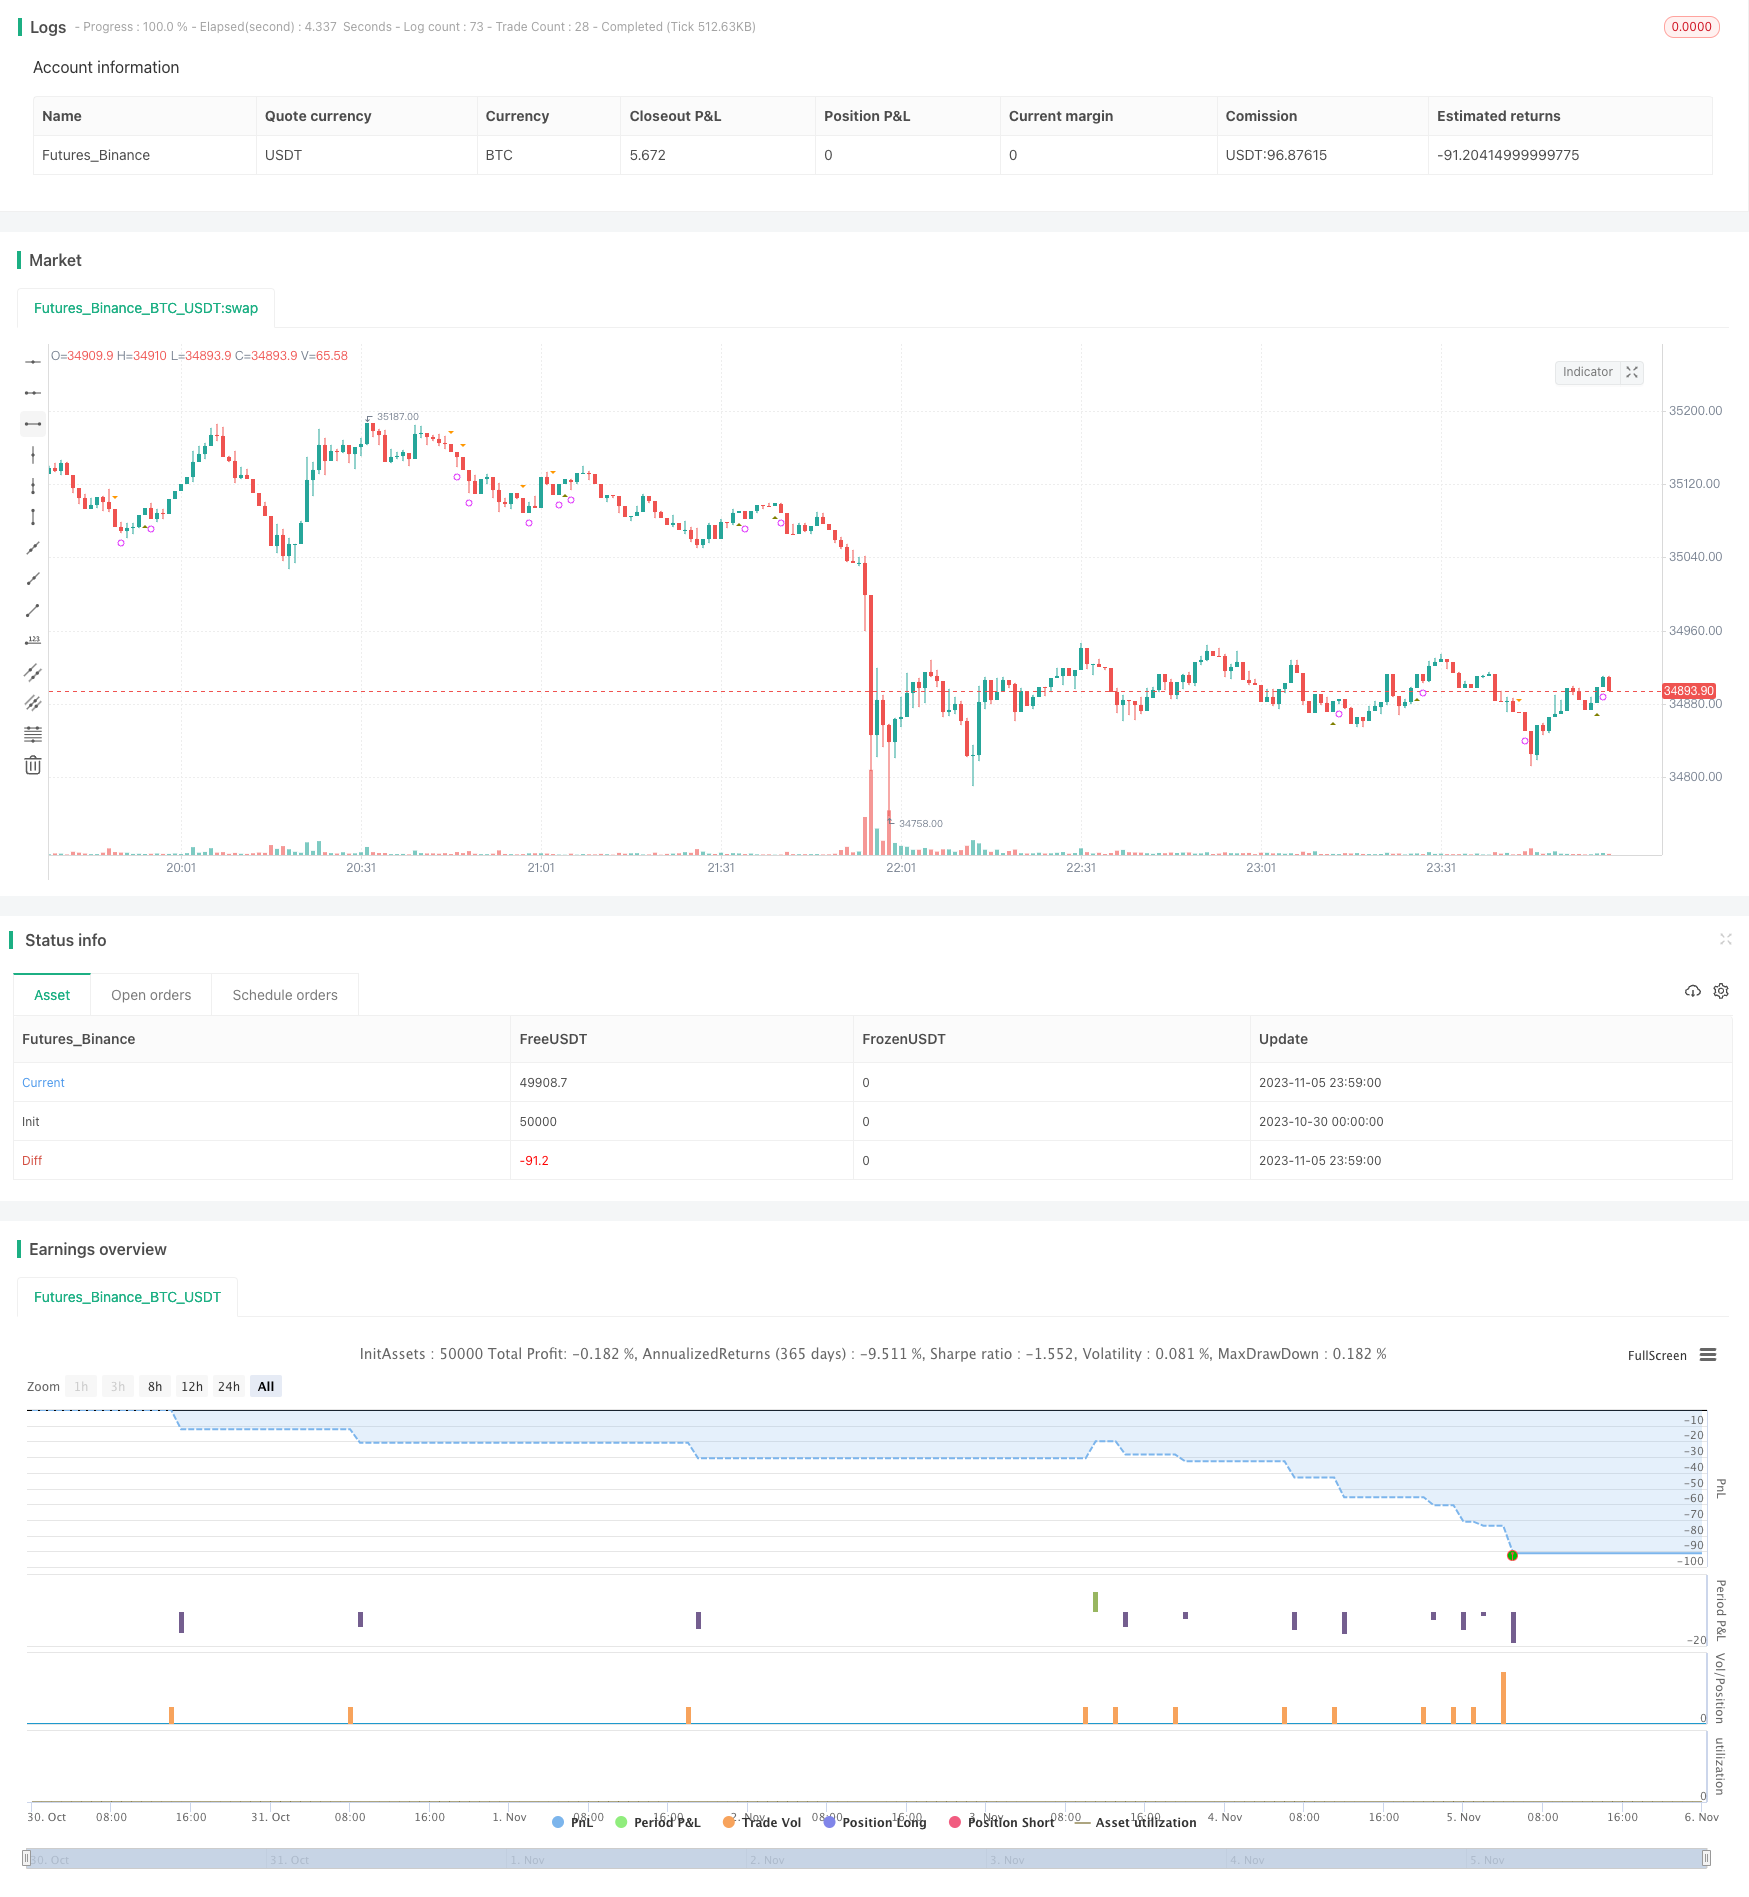
ダブルシャドウリバーサル戦略は,キャンドルスタイルのパターンに基づいた短期的取引戦略である.この戦略は,2つの連続したキャンドルが影を持たない特別なキャンドルスタイルのパターンを検出することによって,潜在的な逆転機会を特定する.この戦略は単純で実行に容易であるが,注意すべき特定のリスクもある.
原則
この戦略の主な論理は,
技術分析理論によると,この二重影パターンは,傾向の逆転を示唆する. 2つの連続したキャンドルで非常に狭い範囲内で変動する価格は,購入力と販売力の均衡を示し,おそらく逆転を暗示する.
二重影パターンを検知すると,戦略は前回の閉店に基づいて次のキャンドルでロングまたはショートに入ります. そして,設定された数のバー後にポジションを閉じる.
利点
-
戦略の論理は単純で理解しやすい シンプルなパターン認識が容易で 実行が容易です
-
典型的な二重影逆転パターンを利用し,技術分析の合理性がある.
-
頻度が低い取引は 費用とリスクを減らすのに役立ちます
-
バックテスト機能を追加し パラメータを最適化します
リスク
-
パターン取引は歴史的なチャート統計と確率に依存し,偏差が起こる可能性があります.
-
2つの影は逆転を示唆するが 実際の逆転は起きないし 持続しないかもしれない.
-
固定利益帯は 急速に変化する市場にうまく対応できないかもしれません
-
限られた情報を見るだけで 熱狂的なエントリができます
改良 の アイデア
-
逆トレンド取引を避けるためにトレンド指標を組み込む.
-
確認を待つエントリを使用して 実際の逆転を確認します
-
固定期間ではなく,ATRに基づいて動的ストップ損失を設定する.
-
機械学習を使って どちらのダブル・シェード・パターンがより信頼性があるかを 判断します
概要
ダブルシャドウリバーサルストラテジーは,パターントレーディングのクラシックコンセプトをシンプルで直感的に活用し,初心者向けに適しており,アルゴのモジュール構成要素としても機能している.しかし,リスク管理は依然として不可欠であり,戦略はエントリータイミングと利益を得る方法を最適化することによって改善することができる.全体的に,この戦略のメリットとデメリットは参考としてかなり明らかである.
/*backtest
start: 2023-10-30 00:00:00
end: 2023-11-06 00:00:00
period: 1m
basePeriod: 1m
exchanges: [{"eid":"Futures_Binance","currency":"BTC_USDT"}]
*/

//@version=3
strategy("No Shadow Candles", overlay=true)

//set inputs
bars_until_close_trade = input(1,"Bars Until Close", minval = 1)
backtest_option = input(true,"Backtest on Twice alert?", bool)

//set conditions
up = close > close[1] and low >= open and high <= close
down = close < close[1] and low >= close and high <= open

up2 = (close > close[1] and low >= open and high <= close) and (close[1] > close[2] and low[1] >= open[1] and high[1] <= close[1])
down2 = (close < close[1] and low >= close and high <= open) and (close[1] < close[2] and low[1] >= close[1] and high[1] <= open[1])

close_trade = barssince(up or down) == bars_until_close_trade
close_trade2 = barssince(up2 or down2) == bars_until_close_trade

//plot indicators
plotshape(up,"Up Marker", shape.triangleup, location.belowbar, color = olive, size = size.tiny, transp = 50)
plotshape(down,"Down Marker", shape.triangledown, location.abovebar, color = orange, size = size.tiny, transp = 50)
plotshape(up2,"Up Twice Marker", shape.triangleup, location.belowbar, color = white, size = size.small)
plotshape(down2,"Down Twice Marker", shape.triangledown, location.abovebar, color = white, size = size.small)
plotshape(close_trade,"Close Trigger", shape.circle, location.belowbar, color = fuchsia, size = size.tiny, transp = 50)
plotshape(close_trade2,"Close Trigger2 (After Twice Alert)", shape.circle, location.belowbar, color = red, size = size.small)

//Strategy Testing


// Component Code Start
// Example usage:
// if testPeriod()
//   strategy.entry("LE", strategy.long)
testStartYear = input(2017, "Backtest Start Year")
testStartMonth = input(01, "Backtest Start Month")
testStartDay = input(2, "Backtest Start Day")
testPeriodStart = timestamp(testStartYear,testStartMonth,testStartDay,0,0)

testStopYear = input(2019, "Backtest Stop Year")
testStopMonth = input(7, "Backtest Stop Month")
testStopDay = input(30, "Backtest Stop Day")
testPeriodStop = timestamp(testStopYear,testStopMonth,testStopDay,0,0)

// A switch to control background coloring of the test period
testPeriodBackground = input(title="Color Background?", type=bool, defval=true)
testPeriodBackgroundColor = testPeriodBackground and (time >= testPeriodStart) and (time <= testPeriodStop) ? #00FF00 : na
bgcolor(testPeriodBackgroundColor, transp=97)

testPeriod() => true
// Component Code Stop

//Entry and Close settings
if testPeriod() and backtest_option == true
    strategy.entry("up2", true, when = up2, limit = close)
    strategy.close("up2", when = close_trade)

if testPeriod() and backtest_option == false
    strategy.entry("up", true,  when = up, limit = close)
    strategy.close("up", when = close_trade)
- 波動性 圧縮 ブレイクアウト 戦略
- ドンチアン・チャネル・ブレイク・トレード・戦略
- RSI True Level ブレイクストラテジー
- RSI逆転ブレイクアウト戦略
- パラボリック SAR ダイナミック ブレイク トリプル SMMA 戦略
- SMAのクロスオーバー戦略
- 変動調整された移動平均取引戦略
- モメントブレイク戦略
- ダウントレンドにおけるショート・トレーディング戦略
- ボリューム価格トレンド逆転 ステップEMAに基づく外為取引戦略
- 2倍速RSI突破戦略
- クロスタイムフレーム ハルフ 移動平均 売買戦略
- モメント トレンド トラッキング 戦略
- カオス的な取引規則 ストップ・ロスト戦略
- VWMAとATRは戦略をフォローする傾向
- KST EMAの動向傾向 戦略をフォローする
- RSI 傾向 戦略 を フォロー する
- 戦略をフォローする2つのタイムフレームDIの傾向
- マルチインジケータースコア取引戦略
- トレンド逆転とエラーズの主要指標コンボ戦略